By Ethan Sleeman | October 5, 2020
Non-CBSA landlords are filing for eviction at a higher eate than their Central CBSA counterparts
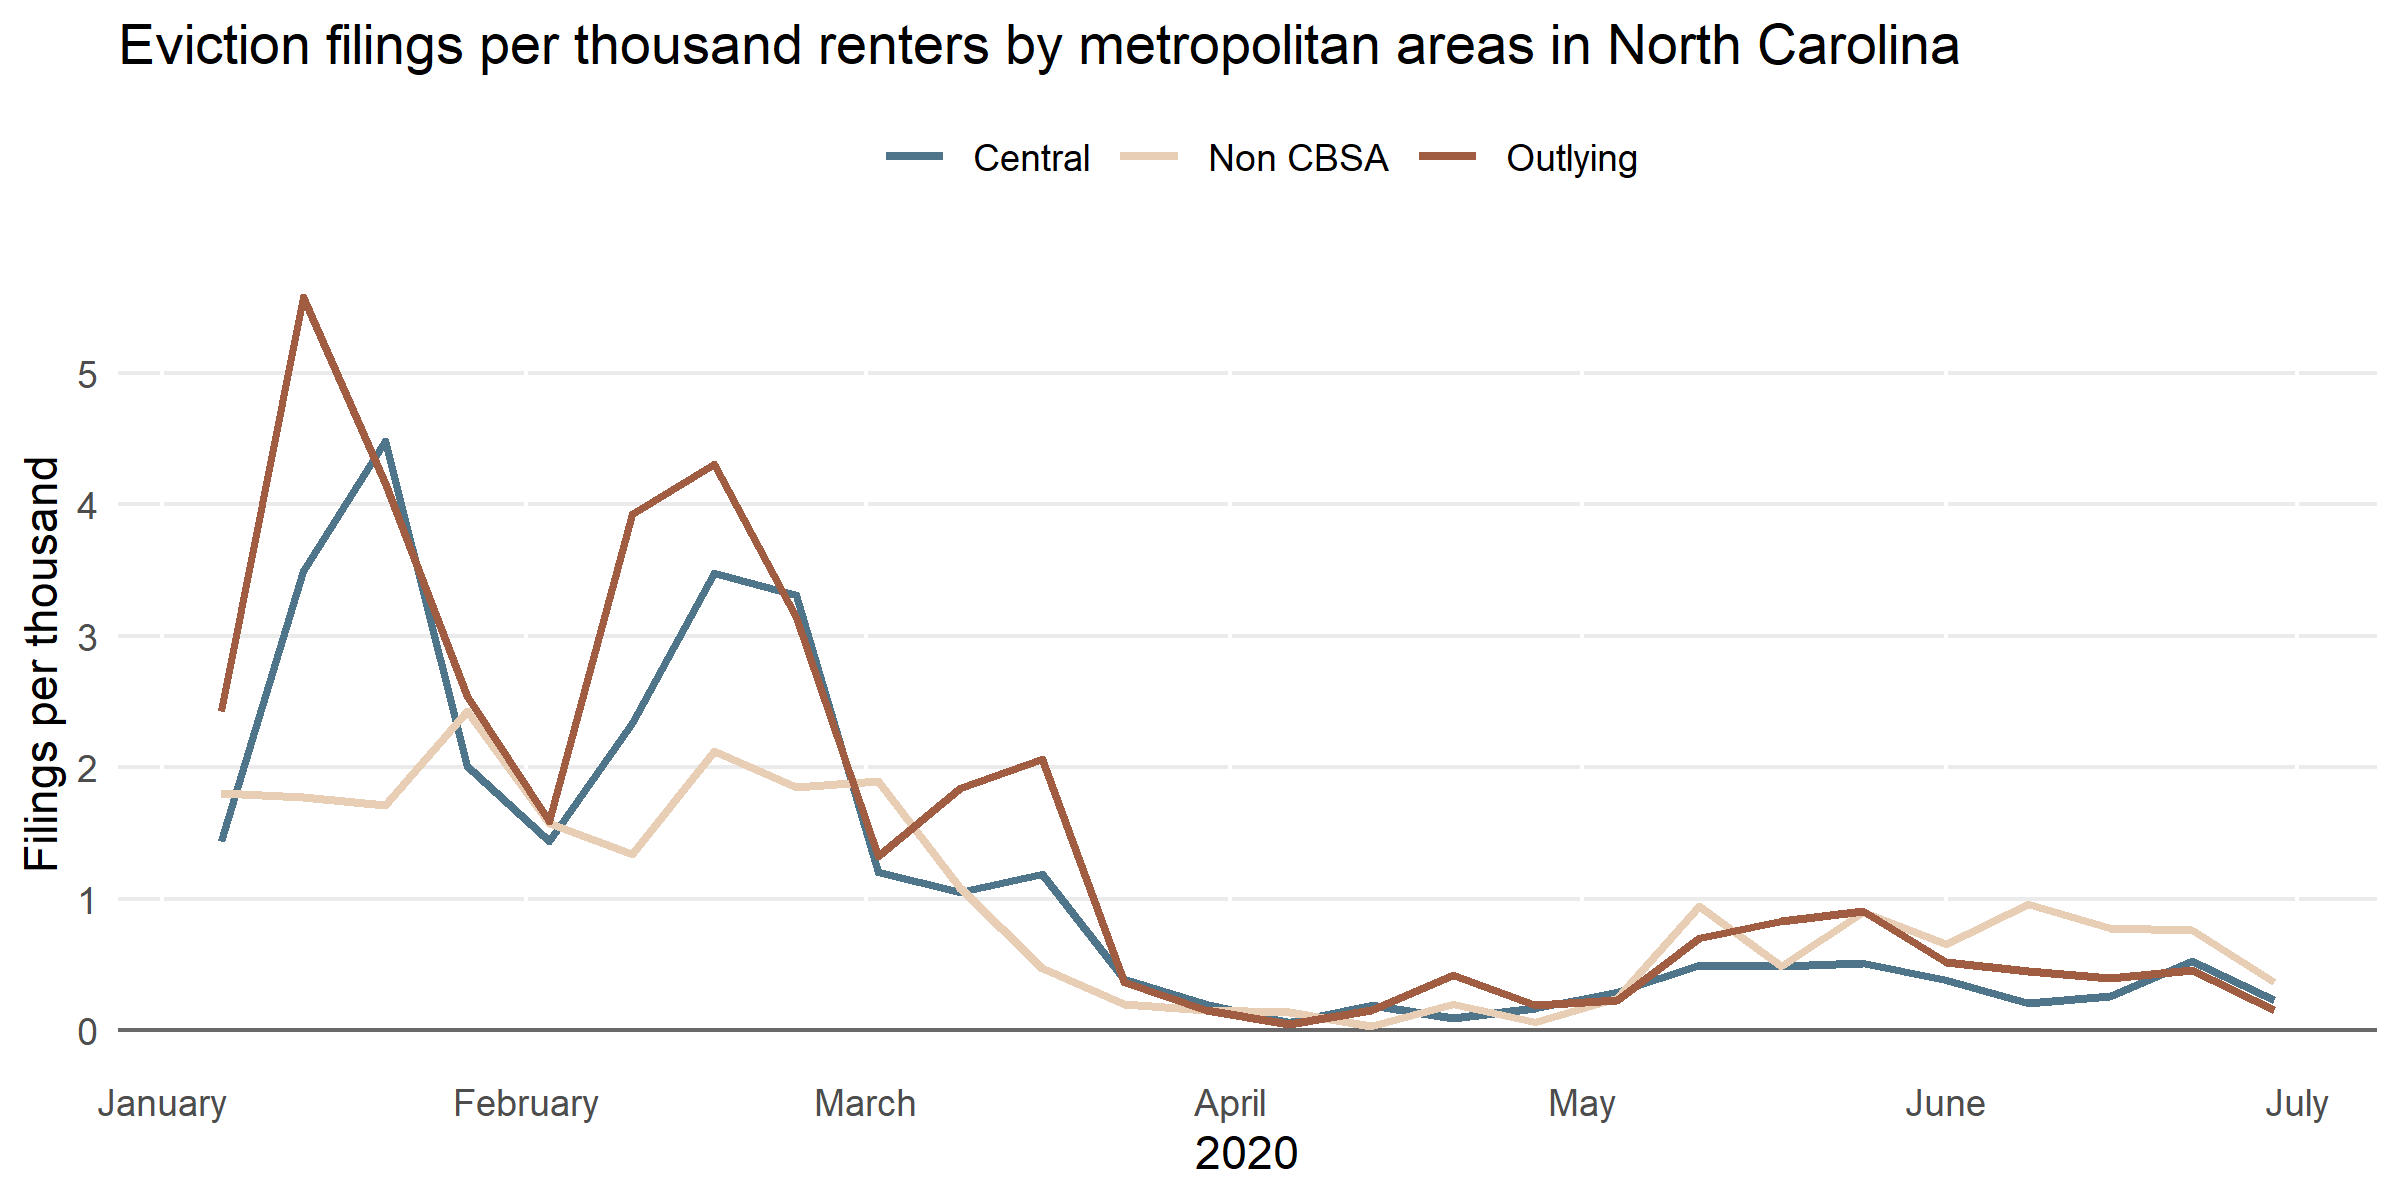
Eviction filing rates, the number of eviction complaints filed for every 1,000 rental households, shifted during the pandemic, according to data procured from the North Carolina Administrative Office of the Courts. Overall, eviction filings began dropping in mid-February, and then dropped precipitously with the onset of the COVID-19 pandemic. In May, filings began to rise again, and have continued to creep higher over the summer. But where previously it had been CBSA counties that showed the highest filing rates, since late April they have been overtaken by non-CBSA counties.
CBSA versus non-CBSA eviction outcome trends
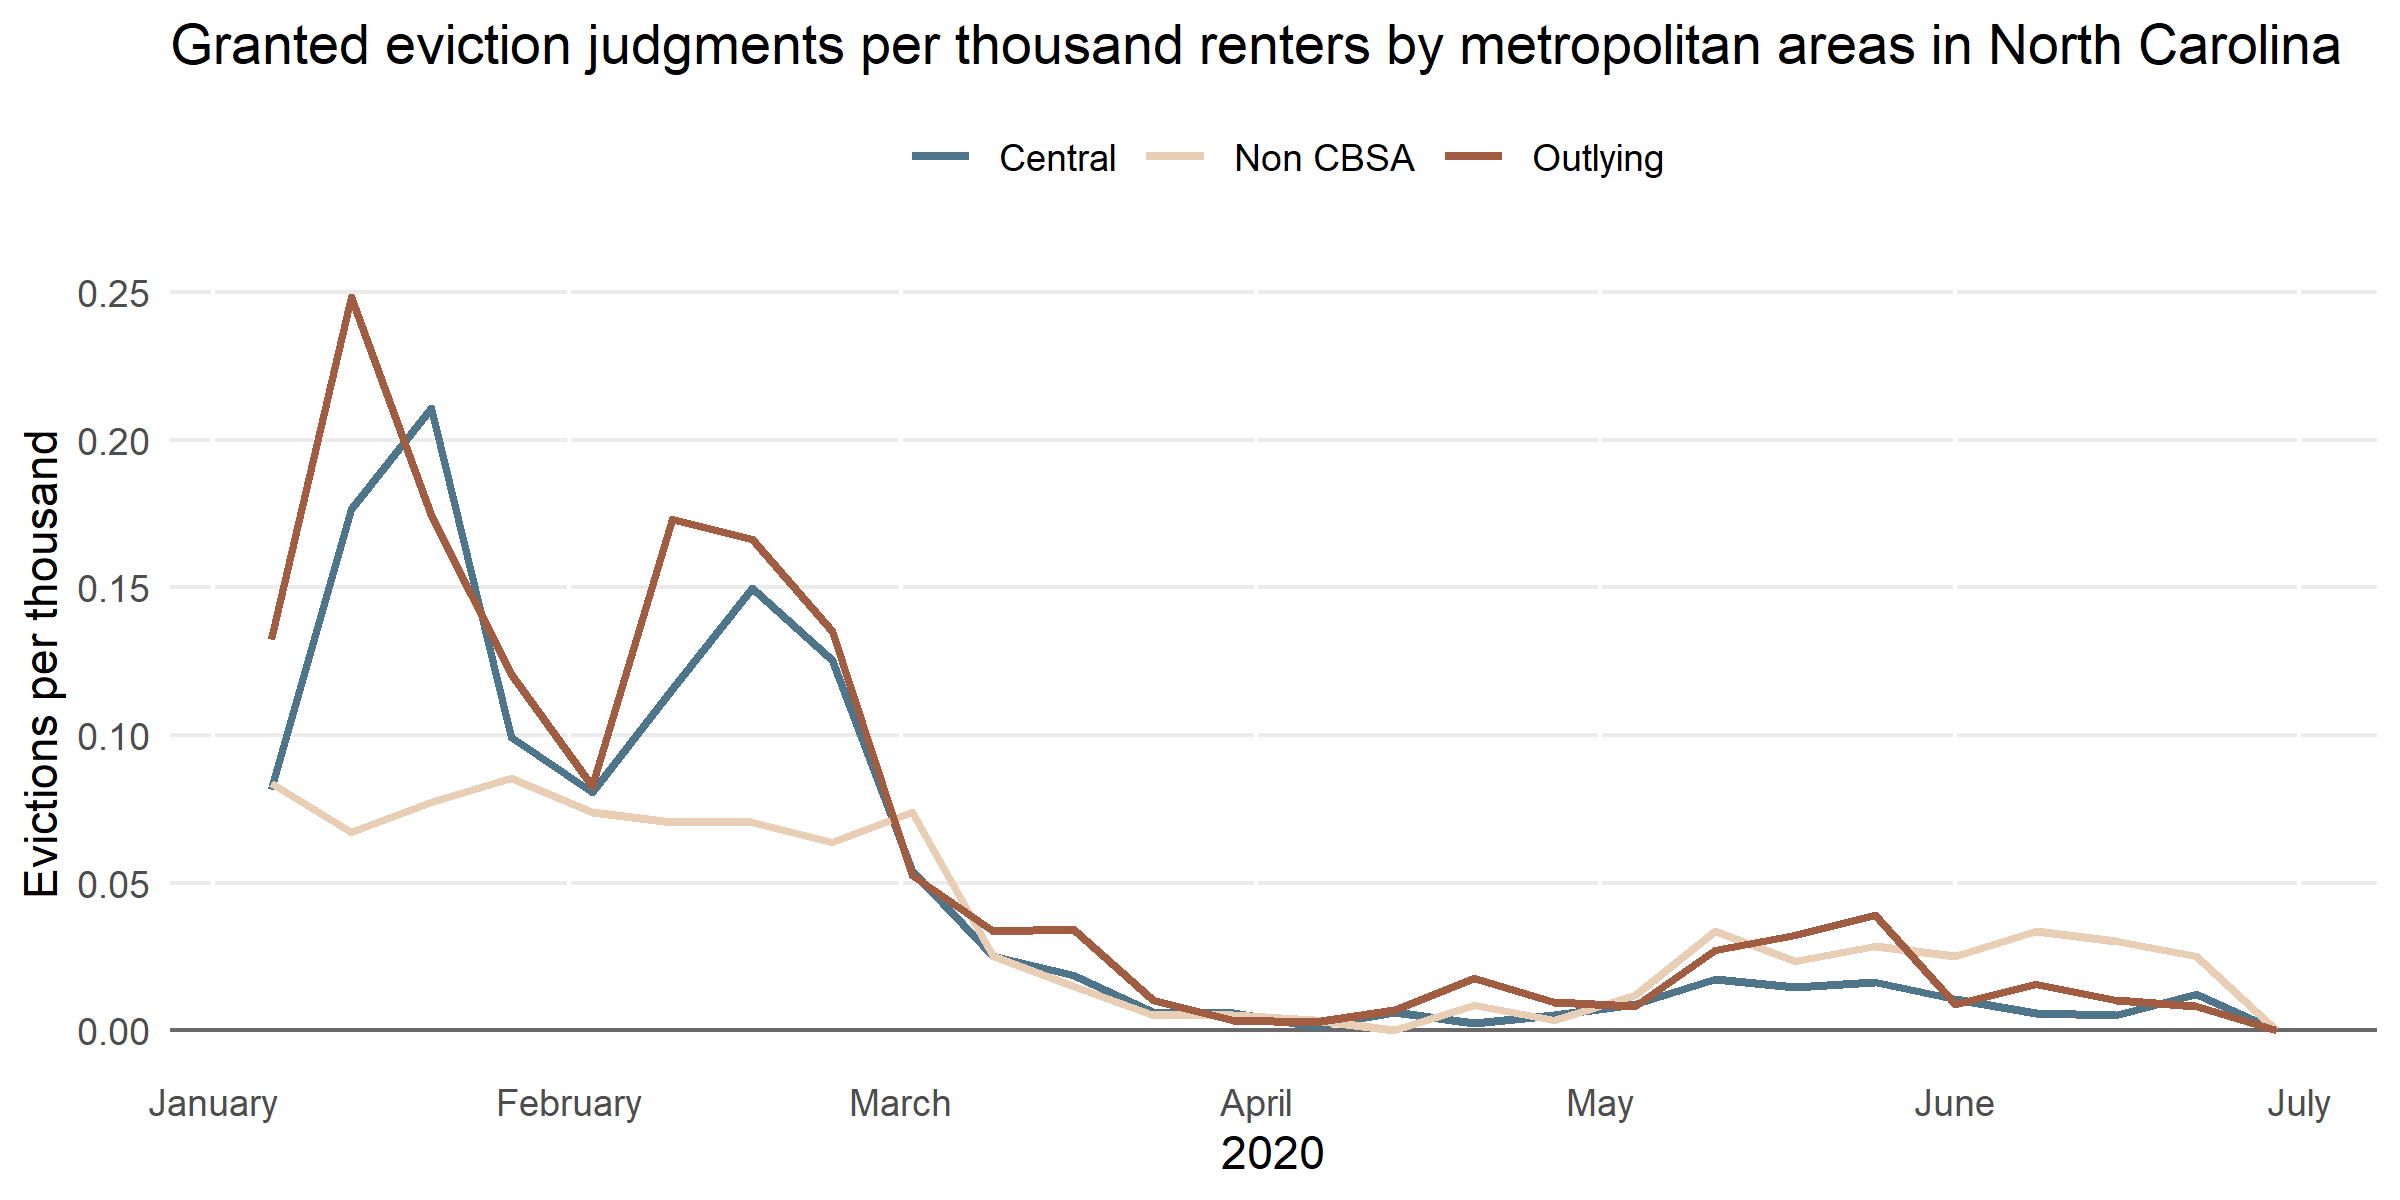
The outcomes of eviction hearings -specifically, whether the magistrate determines that an eviction is appropriate and finds in favor of the landlord- also differ between CBSA and non-CBSA areas. We see important differences in eviction outcomes by OMB classification in the chart. Prior to the pandemic, central CBSA counties saw the highest rates of granted evictions, above both outlying and non-CBSA counties. That pattern flipped during the pandemic and by June, when non-CBSA counties had the highest rates of granted evictions.
Outlying CBSA counties have stayed largely constant, with the exception of a significant spike in early April. While there has been an overall downward trend in the magnitude of filings, it is notable that there are different experiences for renters in different geographic areas, in spite of the universal availability of eviction restrictions.
What’s driving the trend?
One of the more likely culprits is the difference in renter assistance resources between central CBSA counties and non-CBSA counties. In CBSA counties with greater economic and political connectivity, there is often an existing network of non-profit and governmental programs that provide temporary financial support for tenants struggling to pay their rents (such as Orange County’s Emergency Housing Assistance program). For example, the Duke Civil Justice Clinic’s program provides legal aid to tenants in need in the Durham region, often including assistance in the courtroom itself. Non-CBSA renters may not be able to tap those sorts of legal resources, potentially increasing the likelihood that they will lose their hearing or be unaware of their rights as tenants.
There are important questions that policymakers and researchers need to ask about the eviction crisis in North Carolina. Residents of non-CBSA counties in the U.S. have lower rates of broadband access than residents of central CBSA counties. Could this have an impact on non-CBSA renters’ ability to pursue legal aid, or attend remote court hearings? It is possible that other factors are at play as well, such as work schedules, domestic work burdens, or other factors related to differences in daily life found between non-CBSA, outlying CBSA, and central CBSA counties. This points to the need for a better understanding of how the pandemic may have impacted North Carolinians’ ability to attend eviction hearings, or court hearings more generally.
