By Olivia Wang | October 22, 2020
The pandemic has changed mobility trends across the United States. Traffic levels fell dramatically because of the economic shutdown and state and county-mandated stay-at-home orders. As business reopened and people returned to work, travel increased.
Using cellphone location data from Streetlight, the research team tracked the daily Vehicle Miles Travelled (VMT) and examined how COVID-19 affected vehicle travel across varying geographical contexts, based on Core-Based Statistical Areas. The VMT metric measures both the frequency and length of trips of individuals in a region, though it does not capture commercial vehicle traffic. Furthermore, it is unclear if the cellphone location data is representative or complete. Some drivers may not have made their activity patterns available for data collection by Streetlight.
VMT change during COVID-19
“Vehicle Miles Traveled (VMT) in North Carolina” below shows the daily VMT, 7-day moving average VMT, and the percent change in 7-day moving average VMT compared to the baseline. The baseline is a 7-day moving average VMT from the year 2020 compared to the same week in 2019. Using a moving average helps smooth over each seven day period to focus on the overall trend in vehicle travel, while still capturing day-to-day changes.
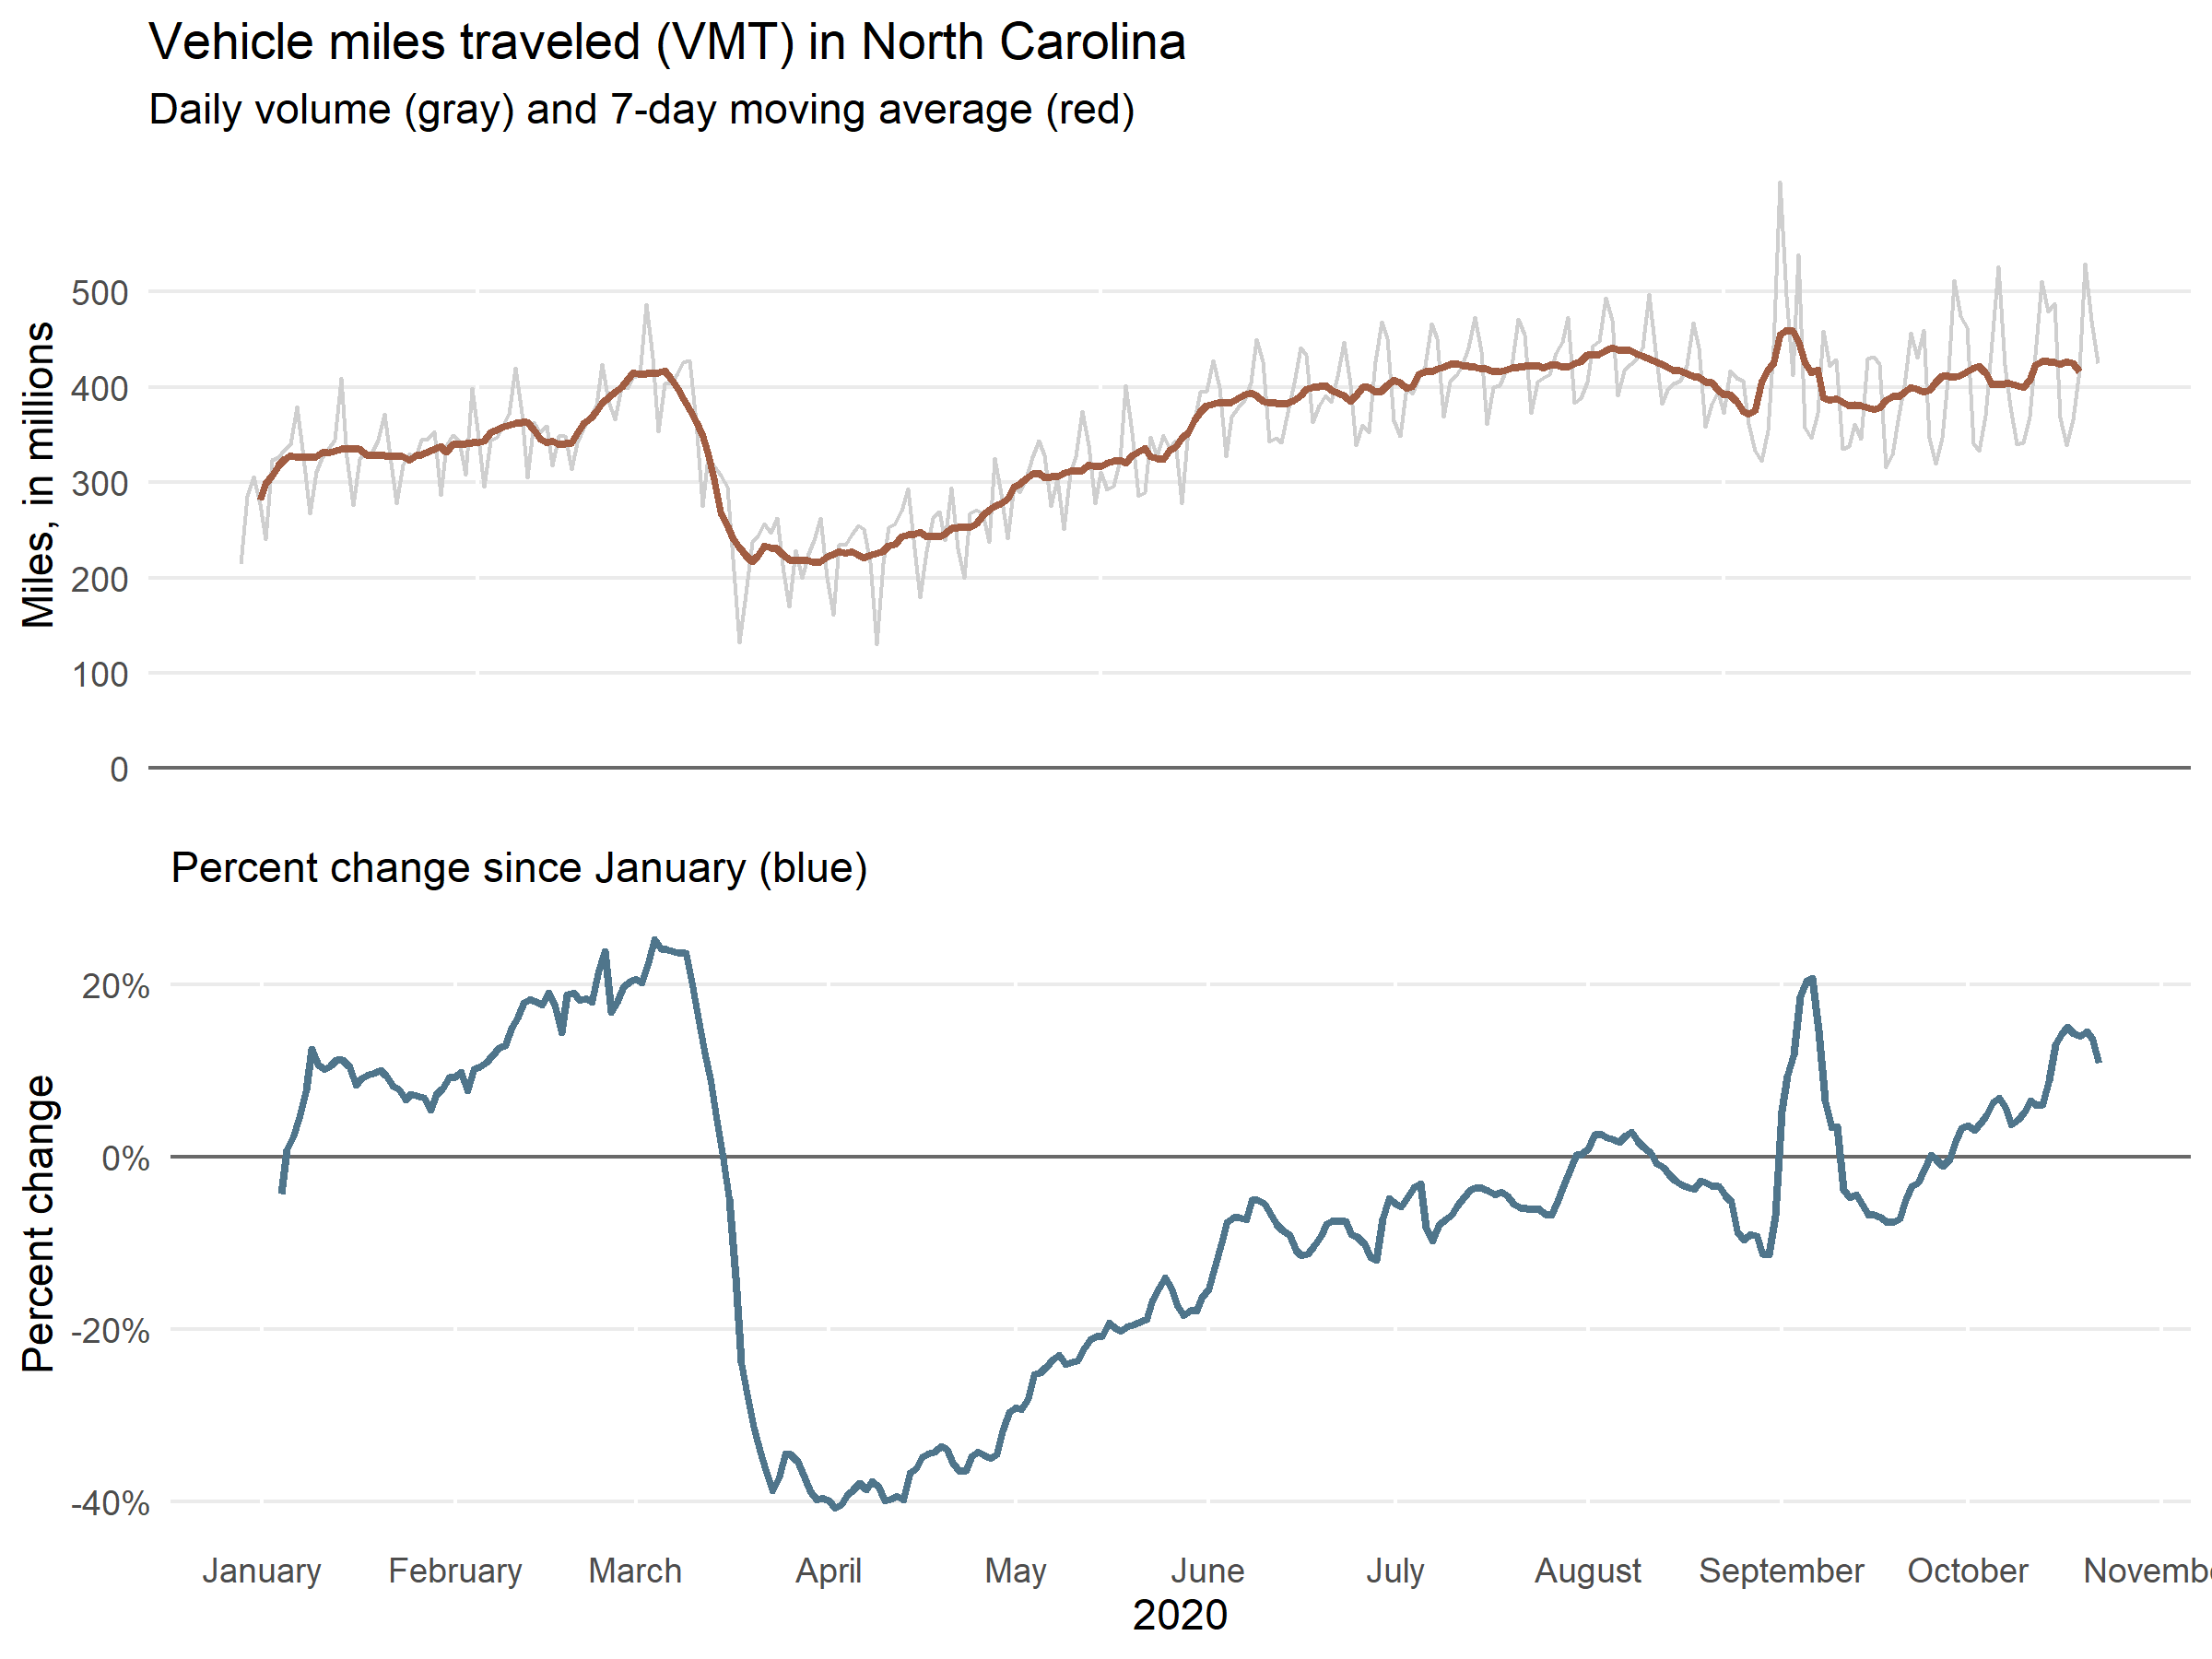
North Carolina saw an increase in VMT from the beginning of January through mid-March 2020, before the state of emergency declaration. VMT started to decrease following NC’s State of Emergency declaration on March 10. In mid-March 2020, vehicle travel almost immediately dropped by 50%. By March 30, 2020, when an executive stay-at-home order was issued, VMT had dropped sharply from 400 million to 200 million, about a 40% decrease compared to 2019. As lockdown restrictions were gradually lifted in May, travel returned to normal levels in some areas. After the Governor lifted the stay-at-home order and moved to Phase 2 reopening in late May, VMT returned to the similar level as previous year.
Geographic disparities in North Carolina’s VMT change
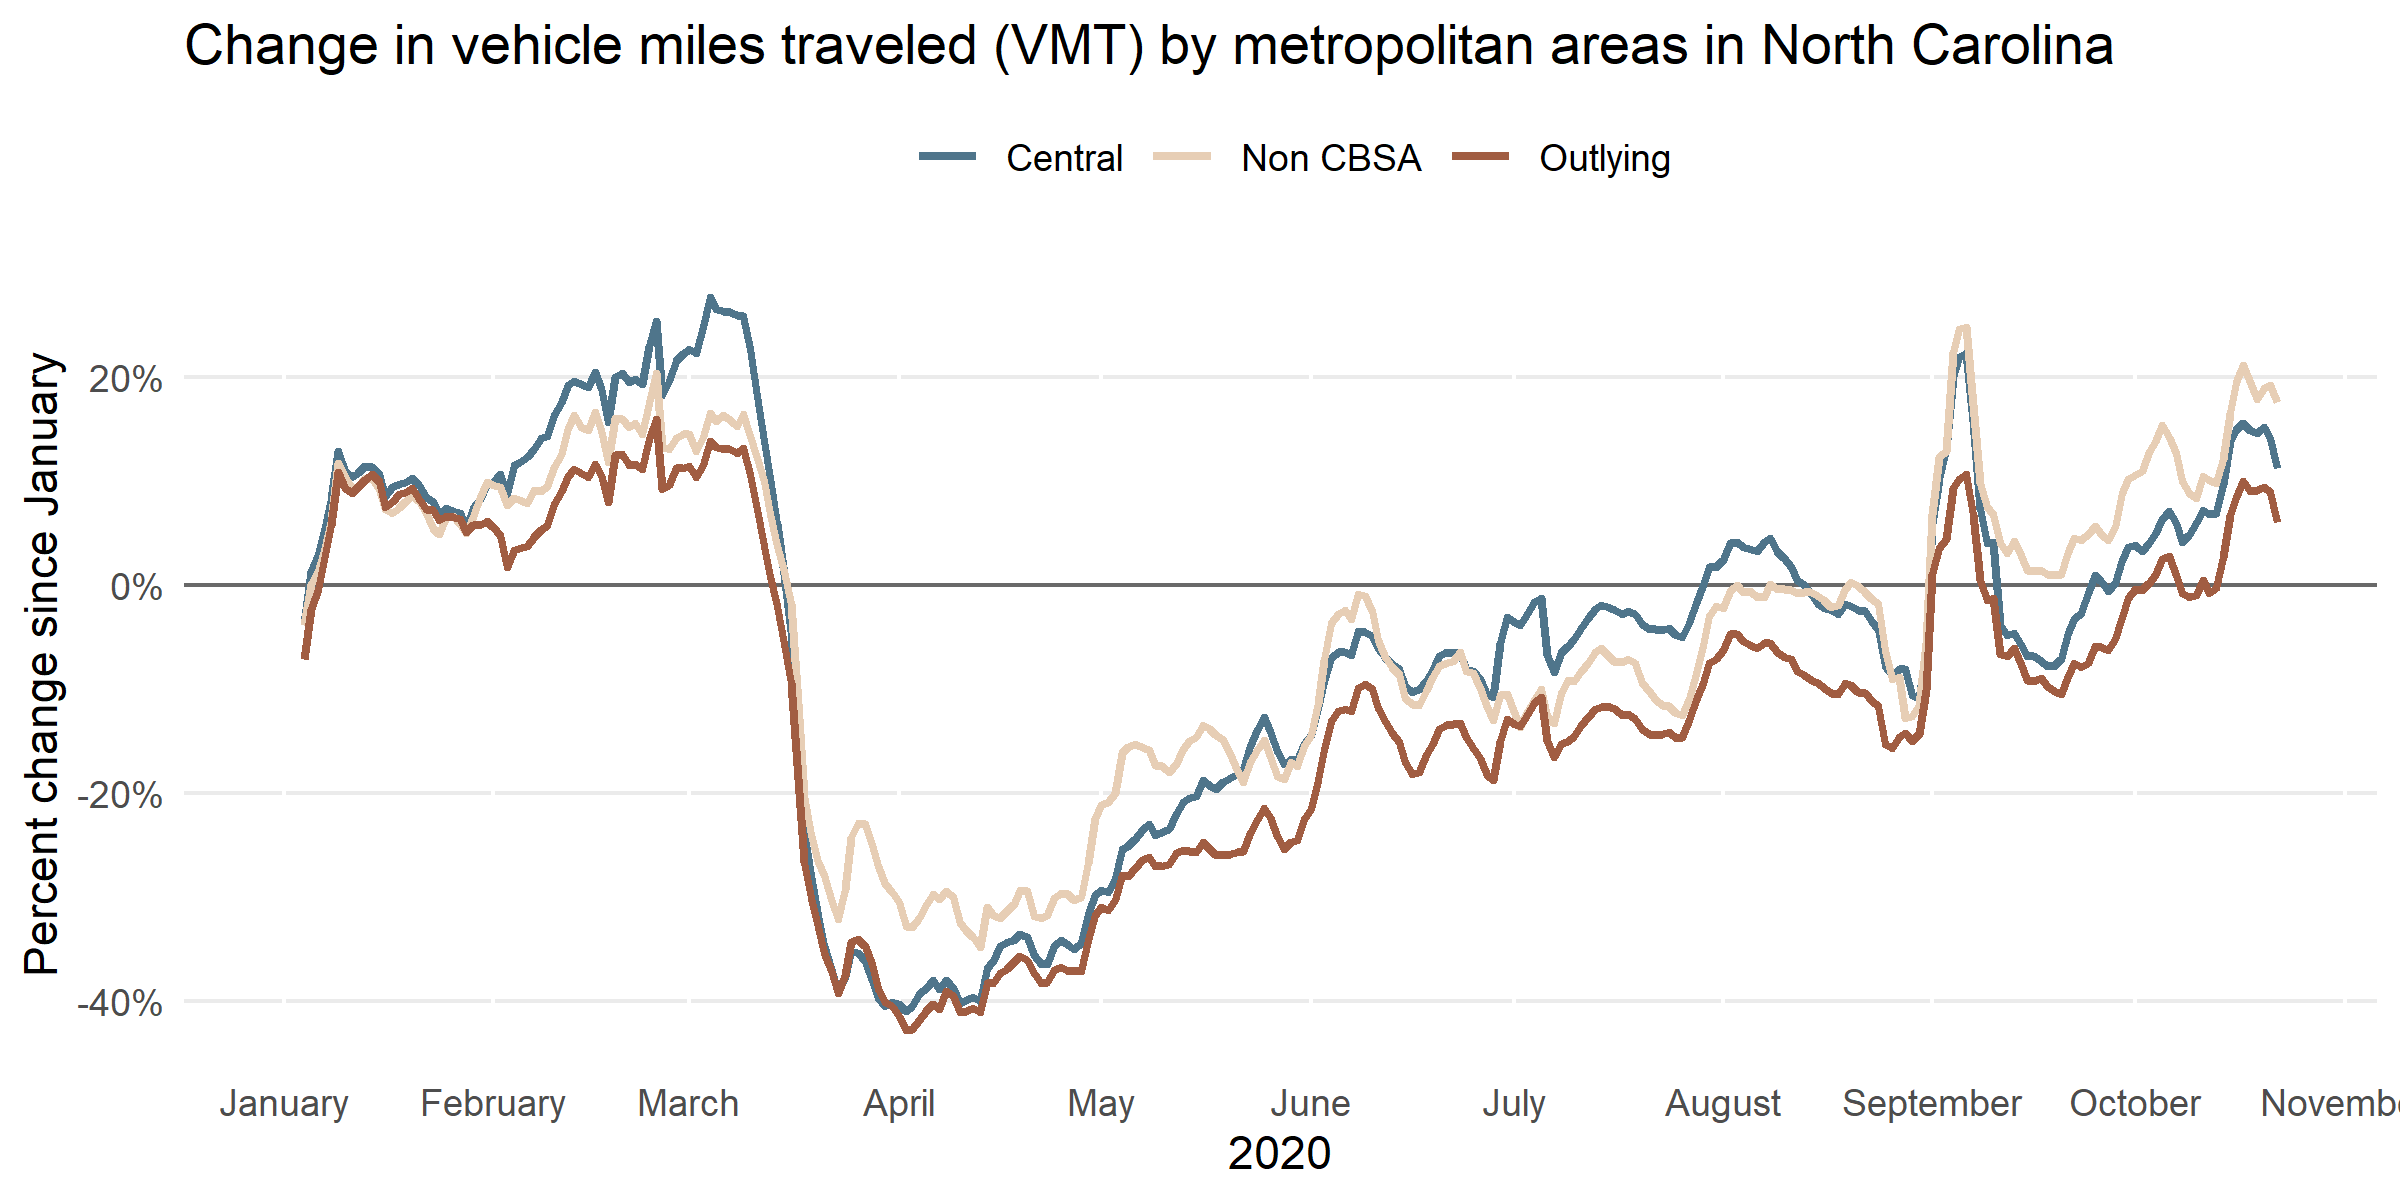
The decline and rebound is geographically uneven, as we can see in the chart below. Central and outlying Core-Based Statistical Area (CBSA) counties showed sharper drops in VMT in March (40% drop) than non-CBSA counties (30% drop). After the stay at home order was lifted in late May, travel in central counties almost recovered to the same level as 2019 in early June. In outlying and Non-CBSA counties, the rebound was not as robust; the current levels are 10% lower compared to last year.
How has the pandemic affected VMT in our state?
There are important questions raised by the VMT data. Why have we seen a persistent difference in vehicle travel between central CBSA counties and both outlying CBSA and non-CBSA counties? Is it possible that the employment structure of outlying CBSA and non-CBSA counties has contributed to this divergence? As researchers and policymakers puzzle through these and related questions, they should also consider how and whether gender disparities have intensified as well. After all, peoples’ mobility patterns are not only tied to their labor force participation, but their responsibilities and work demands at home. If women’s mobility has declined greatly in outlying CBSA and non-CBSA counties, it suggests potentially worrying or signs of even larger declines in household income and livelihood to come.
