By Kshitiz Khanal and Nichola Lowe | February 9, 2021
By April 2020 unemployment in the US reached a historic high, hitting communities of color, and low-earning workers among them, the hardest. According to the Center on Budget and Policy Priorities, 58% of jobs were lost between February and December 2020 in industries paying the lowest wages, even though those jobs only represent 30% of total US employment. Our analysis of jobs openings posted to the web show similar trends in North Carolina.
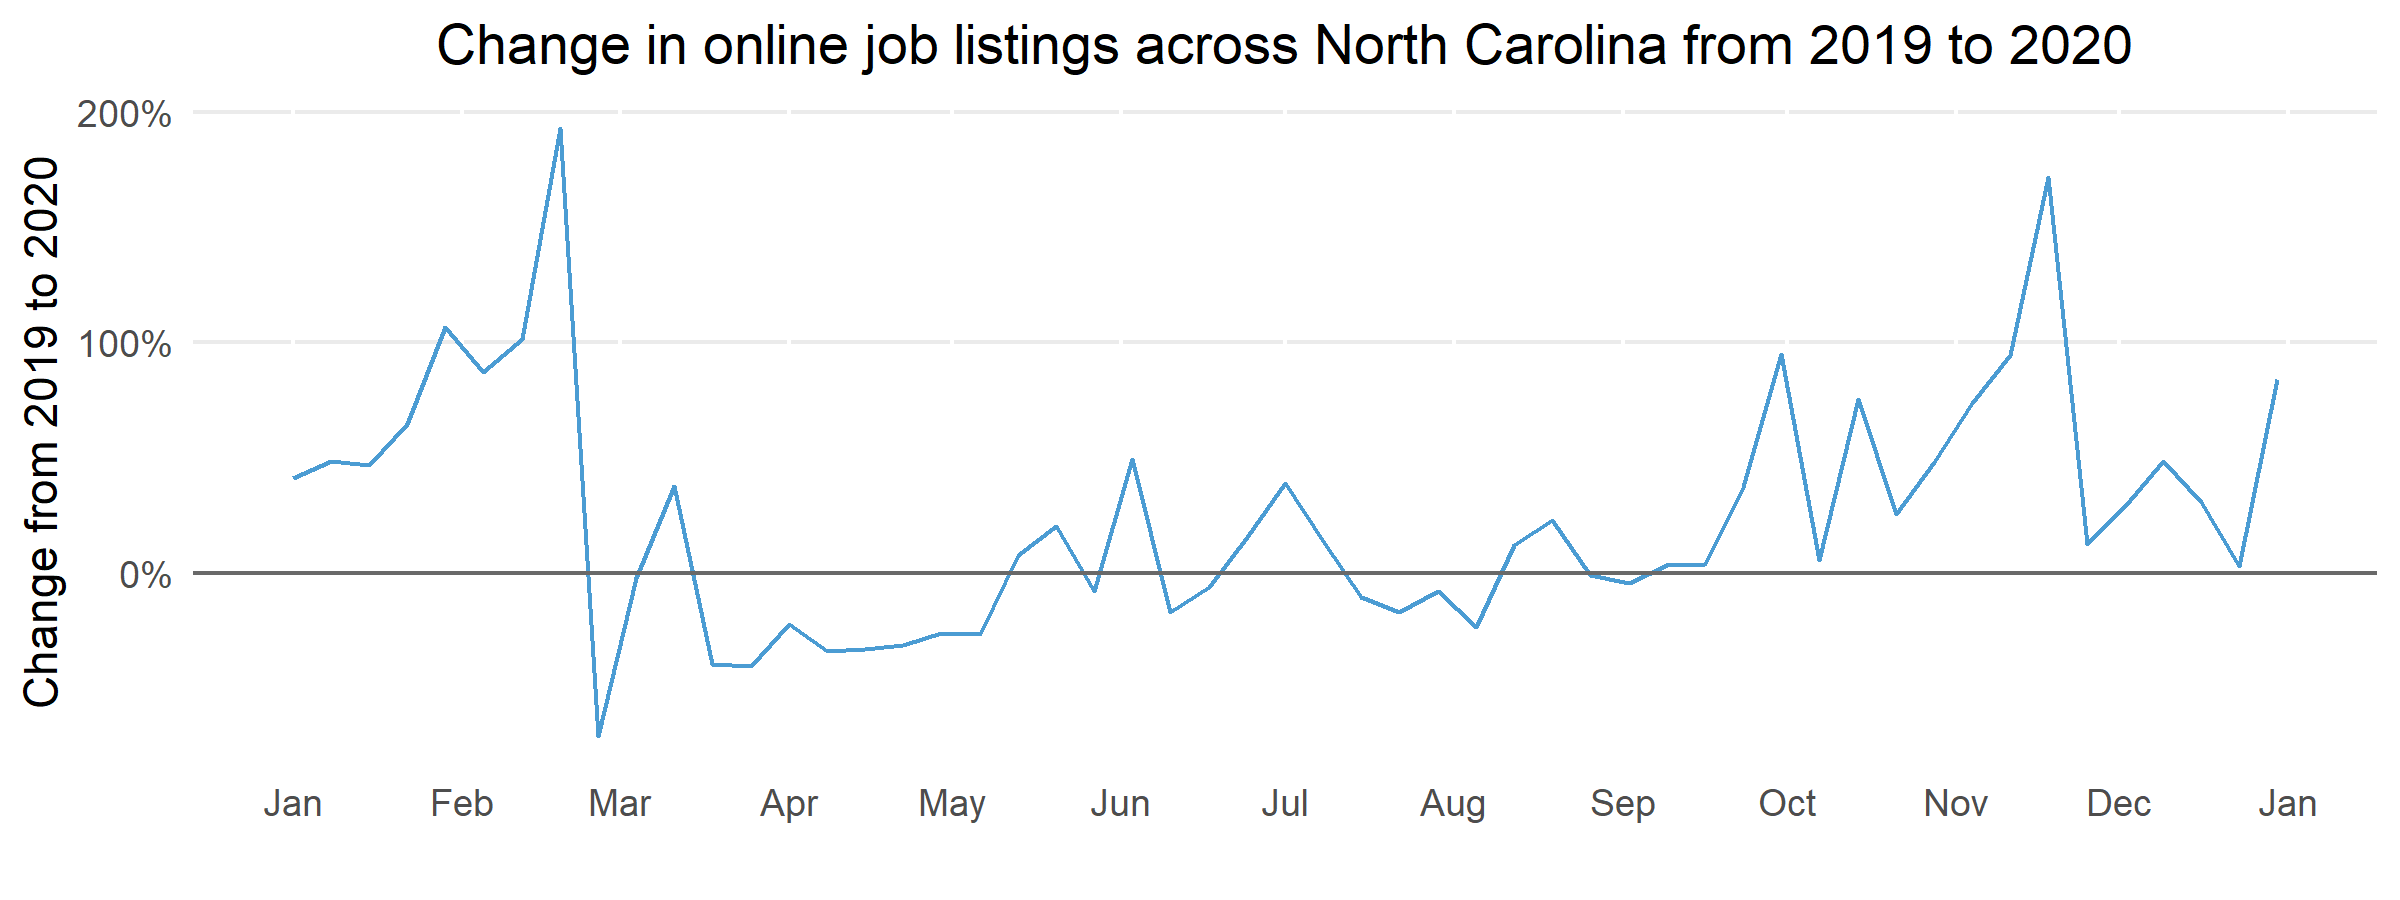
Number of jobs openings compared to 2019
Not all job openings are posted online. The data we present here is from Greenwich, a human resources intelligence company, that captures information for close to 70% of all jobs listed online. The missing 30% of job postings include those on the extreme ends of the salary spectrum that are less likely to be advertised online. It also misses most government job openings, meaning the trends described here may miss pockets of labor market rebound or stagnation.
Still, even without a full set, we can identify important patterns. The table below for North Carolina compares each month in 2020 to the corresponding month back in 2019, capturing whether postings for 2020 surpass or lag what was set as a total for the same month last year. We see that job openings were significantly lower for March 2020 compared to March 2019. However, we also see a steady rise from that monthly historic low through November, when postings for 2020 were much higher than for the same month in 2019. A seasonal downturn is normal for the month of December, as are returning numbers in January, though national economic reporting suggests this rebound could be short-lived.
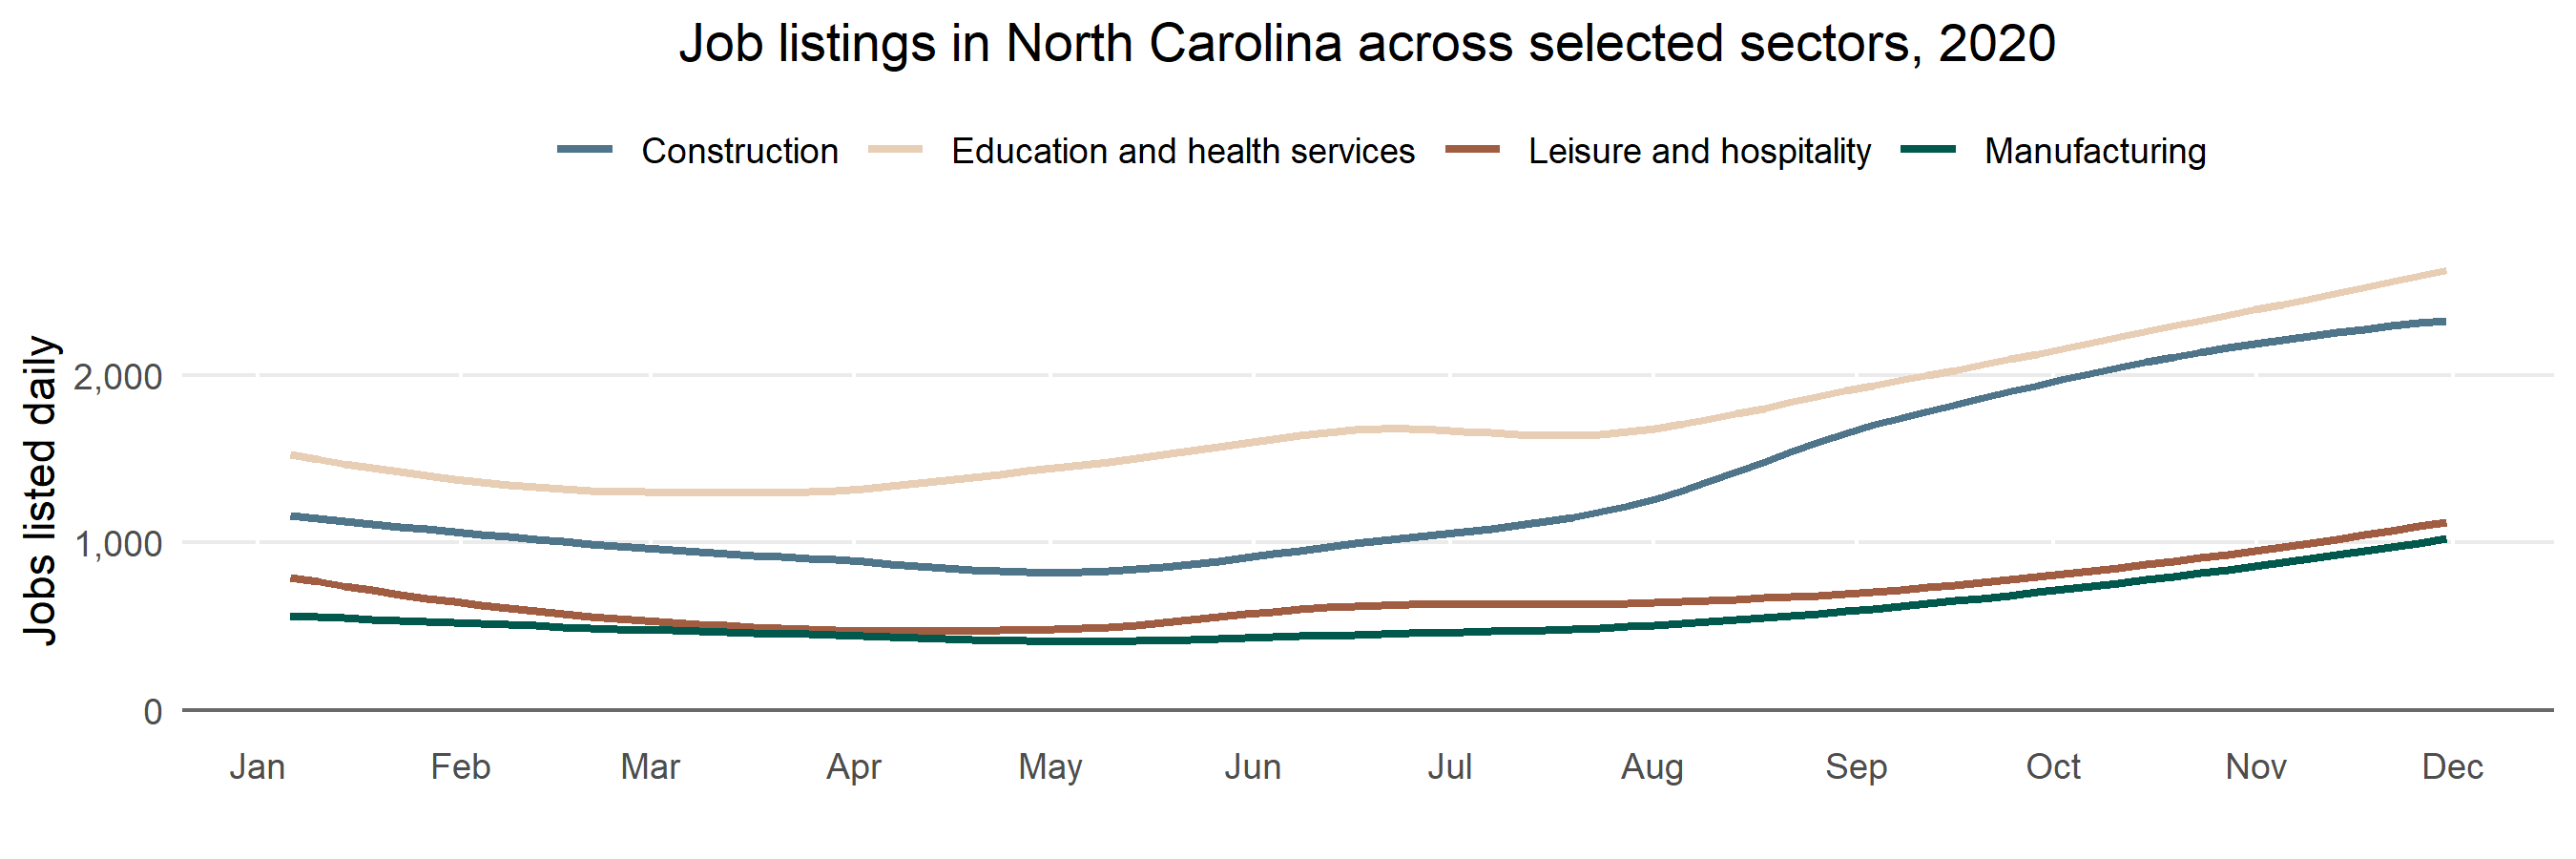
We also find that all sectors experienced a post-pandemic decline and some recovery. But absolute job openings in the combined category of education and health services rebound the most, likely driven by pandemic-induced healthcare demand. Construction also saw a notable uptick in job openings over the course of 2020, as did professional and business services.
All other sectors in North Carolina experienced a more modest rebound, including in leisure and hospitality, trade, transportation and utilities, and manufacturing.
Sub-Sector Trends
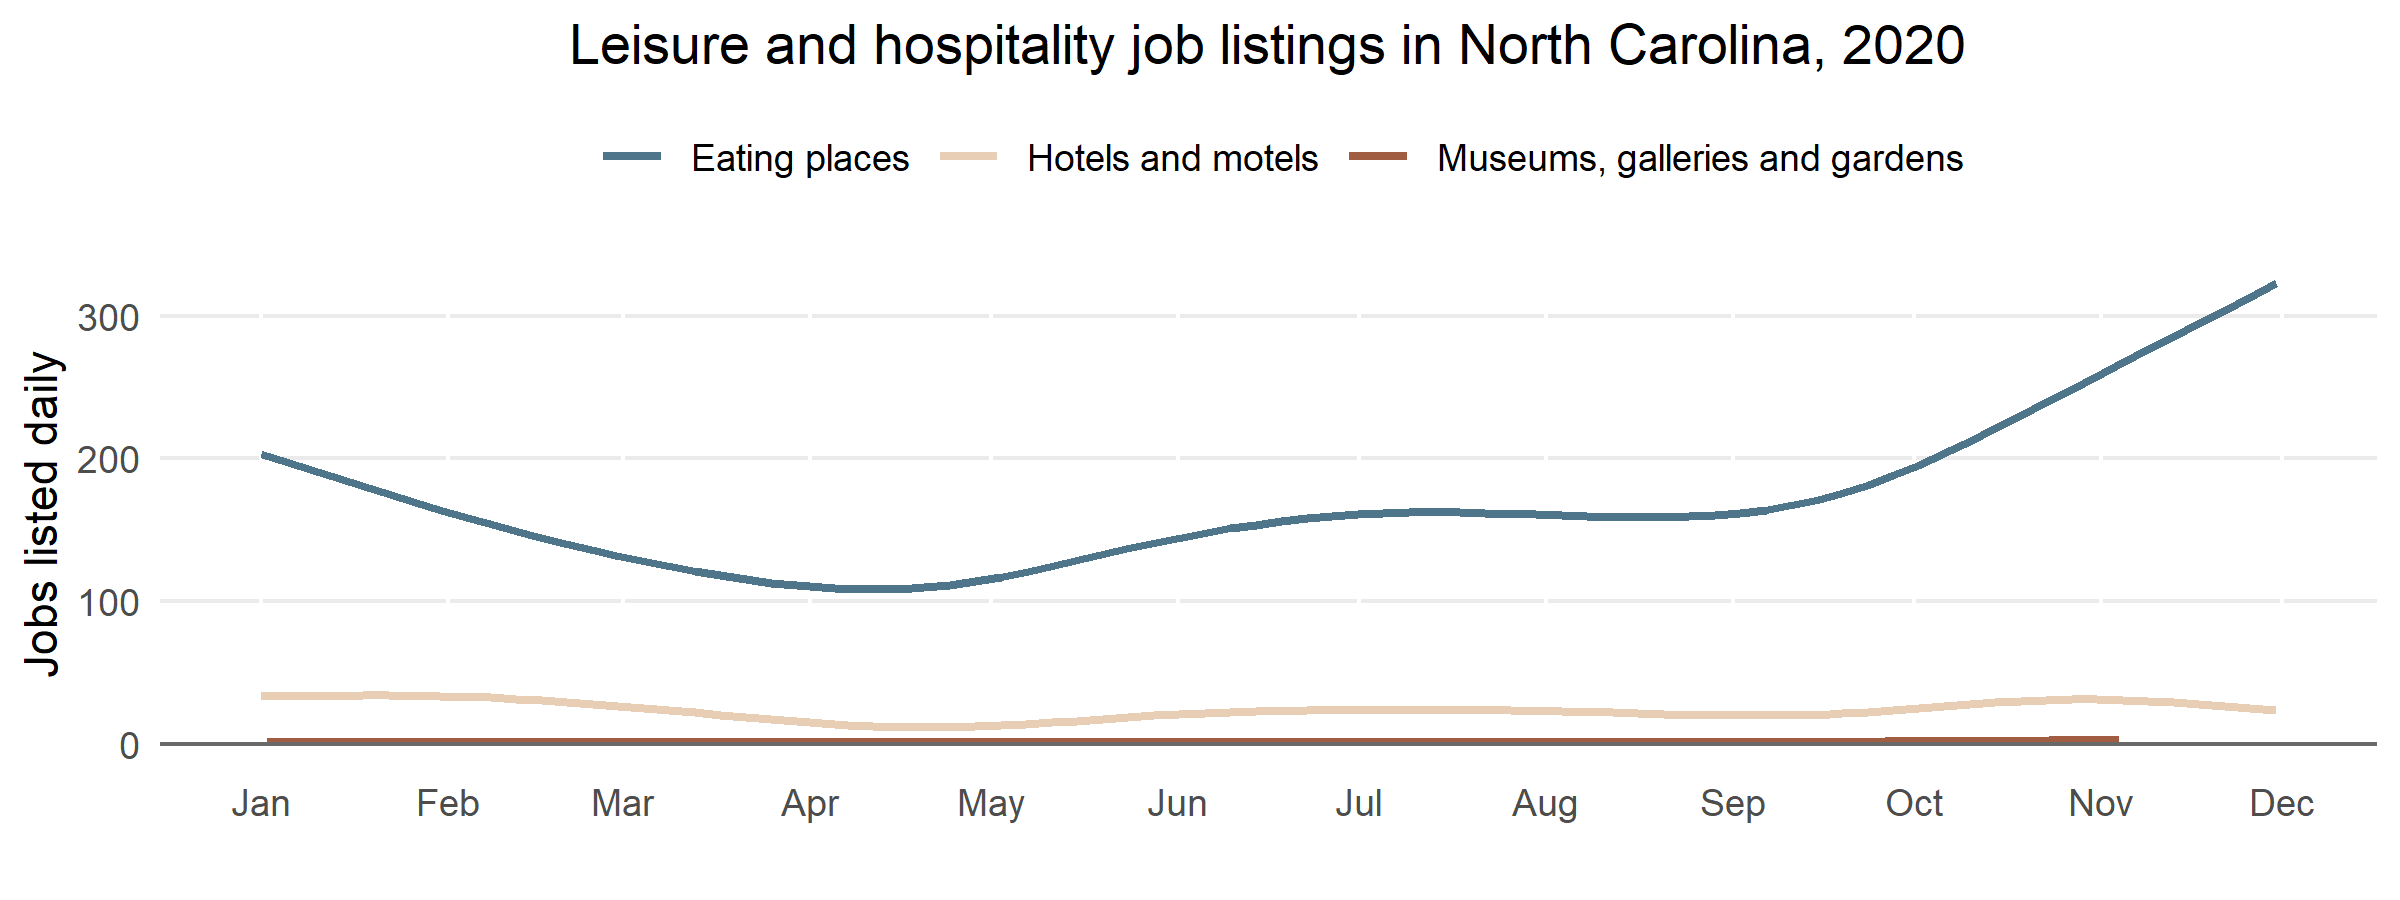
We also took a closer look within the hospitality and manufacturing sectors–two sectors that depend on in-person work and had to lay-off large numbers of workers in the early months of the pandemic–to explore what specific types of business establishments are driving these job openings.
Most of the openings after April 2020 in leisure and hospitality are within restaurants, especially fast-food and drive-through chains such as Taco Bell, Burger King, Chilli’s and McDonald’s, among others. Meanwhile, jobs in hotels and motels and other places that people visit in person, such as museums, galleries and gardens remain relatively stable at low numbers.
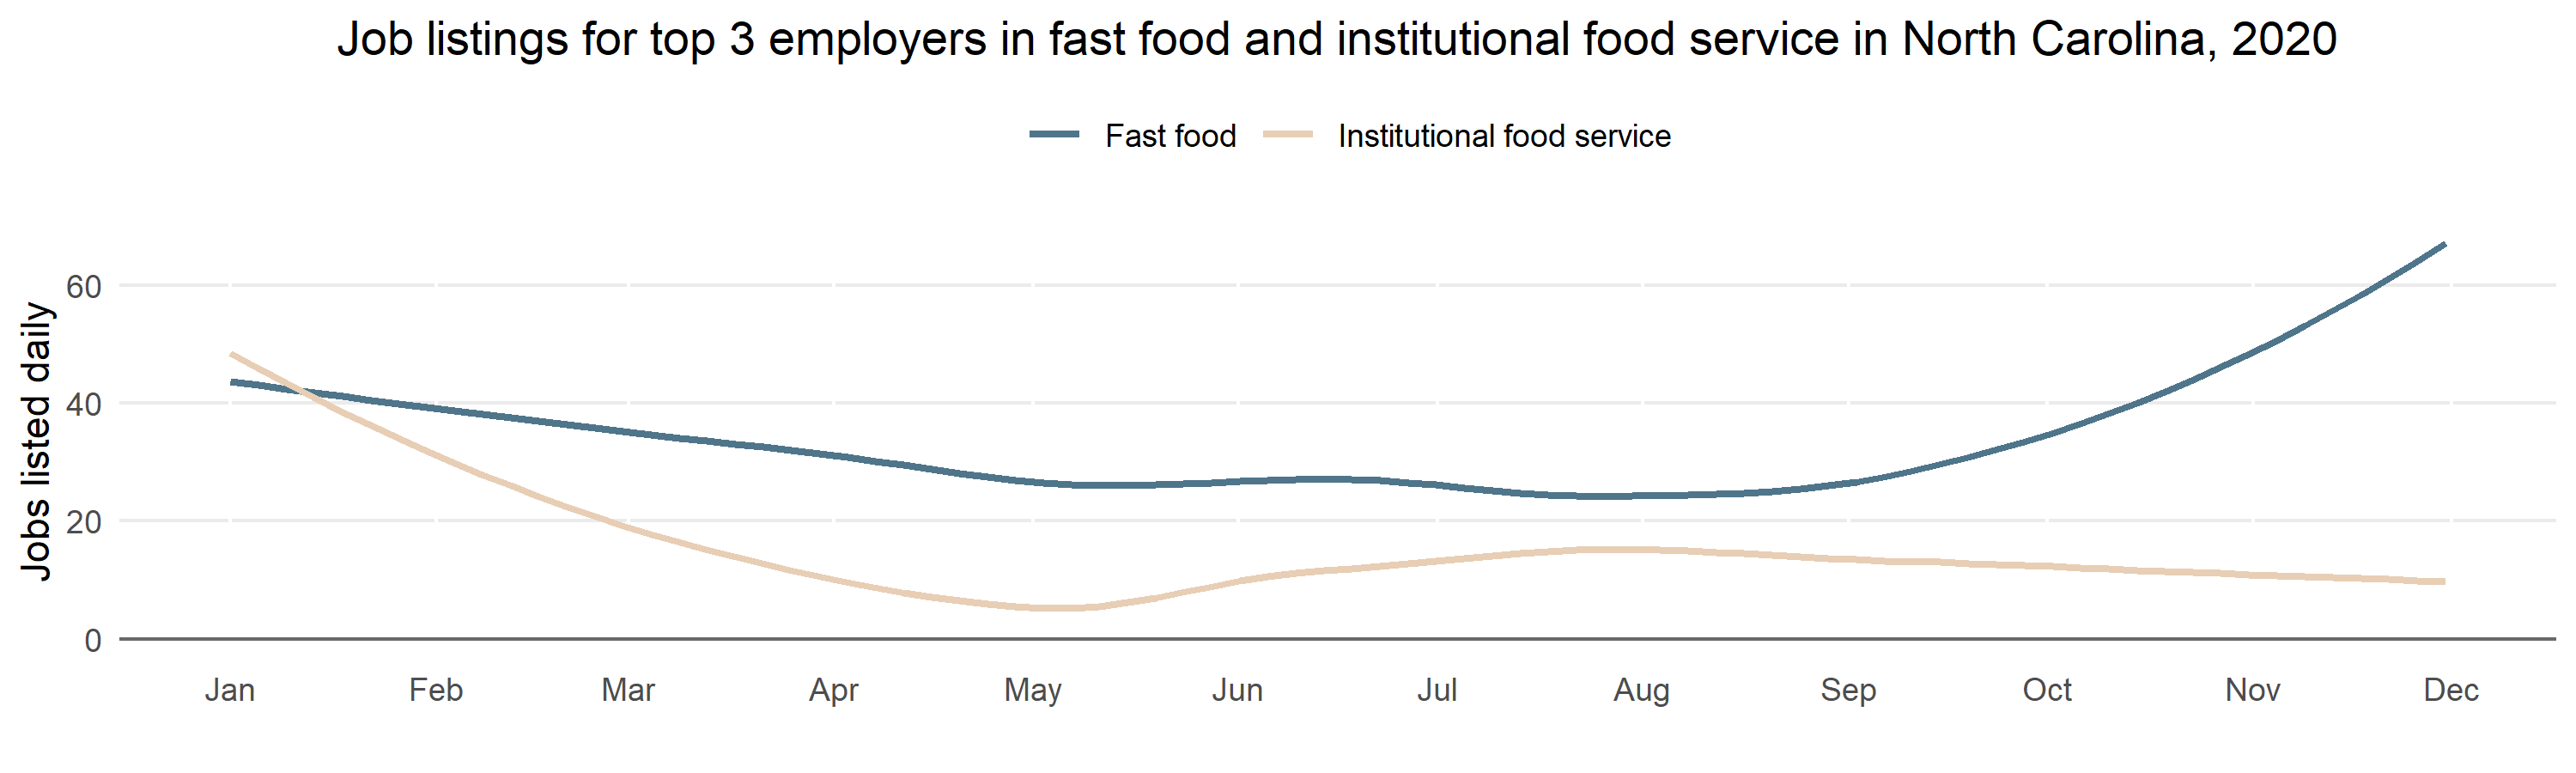
Similar variation is observed when we compare fast food restaurants with institutional food service providers. The latter include firms that manage university cafeterias or catering for conventions or other large events, such as Aramark and Compass Group USA. Among the top three employers of each of those sub-sectors, job postings in the institutional food service group partially recovered before trailing off again in August 2020. By contrast, job openings at fast food chains increased significantly after bottoming out that month.
Manufacturing also shows variation across different production specializations. We find that most of the job opening growth is driven by metal products, followed by wood, petroleum, chemicals and finally food products. Manufacturing job openings across all these sub-sectors bounced back higher than January 2020 levels. Prior to the pandemic, manufacturing firms in North Carolina were already struggling with significant worker shortages, which may have intensified as workers with school-aged children have been unable to return to work. The rapid spread of COVID-19 within meat processing plants is a well-known concern–one potentially made worse by Federal lapses in workplace inspections–which could also explain additional hiring pressure.
Jobs across several salary ranges
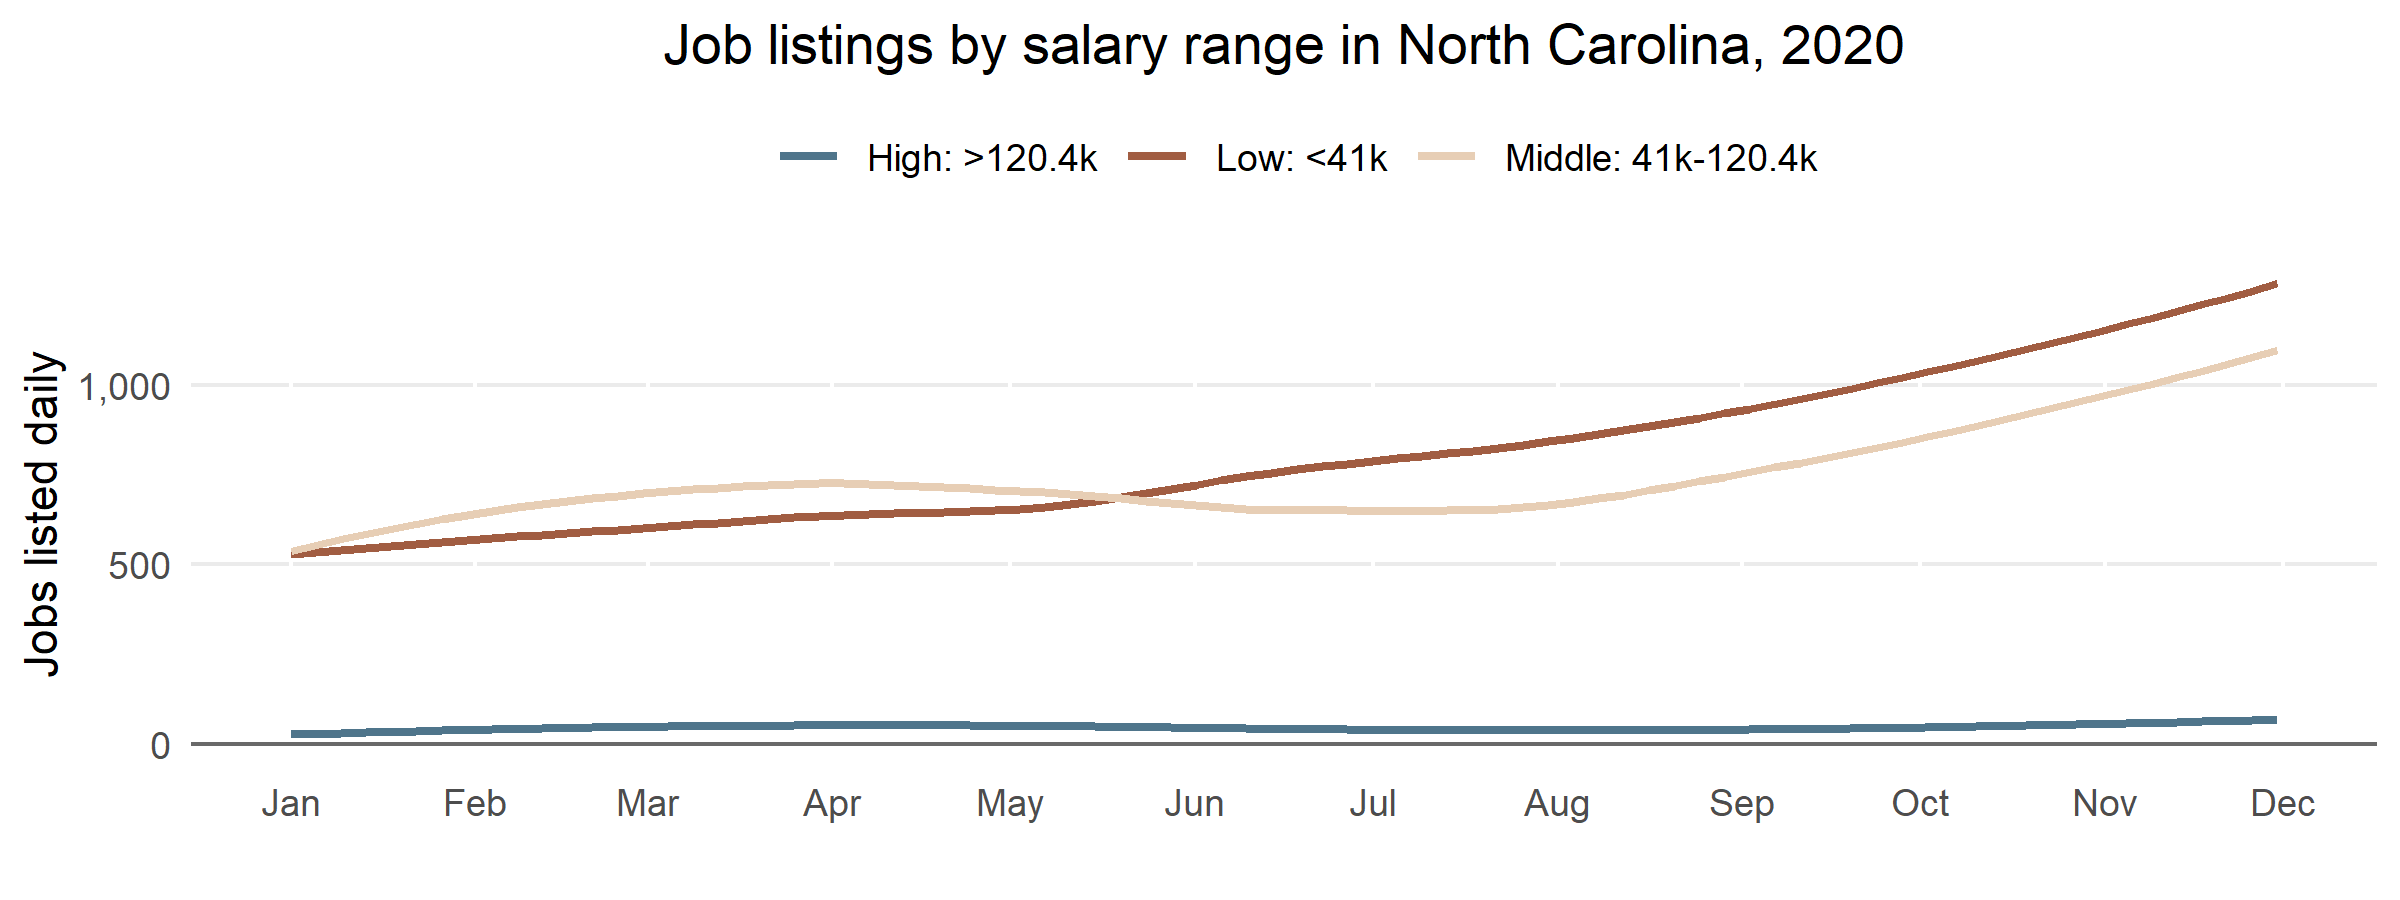
Finally, it is important to consider the salary range for these jobs, as not all openings pay family-sustaining wages. Jobs are categorized as low-paying if their full-time wages amount to less than $41,000 in annual income–a cut off that is based on an income classification for a three member household by Pew research center. In July, we observe a clear uptick in job openings for all salary ranges. But what is also clear is the steady rise in job openings for lower paying positions, which surpassed middle income job listings back in May 2020 and have retained a leading edge ever since.
The data at hand is insufficient to make definite inferences, but it does raise questions about current and future hiring practices. Is this rise in low-paying jobs a reflection of increased demand for services that are now described as “essential”? Or is this concentrated growth at the lower end of the pay scale due to increased worker turn-over, either because employers are unwilling to pay more to keep workers from leaving, or worse still, are unable to protect their workforce from COVID-19 infection? Whatever the cause, these data do point to a persistent and growing job quality problem in North Carolina–one that predates this pandemic. Policy actions to raise wages and job quality standards, including industry support to help employers implement “good jobs” strategies, are necessary. Without these reinforcing steps, economic recovery will be out of reach for far too many North Carolinians.
