By Kaitlin Heatwole | November 30, 2020
Mass layoffs during the COVID-19 recession have grabbed headlines, and for good reason. Layoffs and furloughs are disturbing evidence of the negative impact the pandemic is having on peoples’ lives.
Like the rest of the country, North Carolina experienced a surge in layoff events with the onset of the COVID-19 recession.
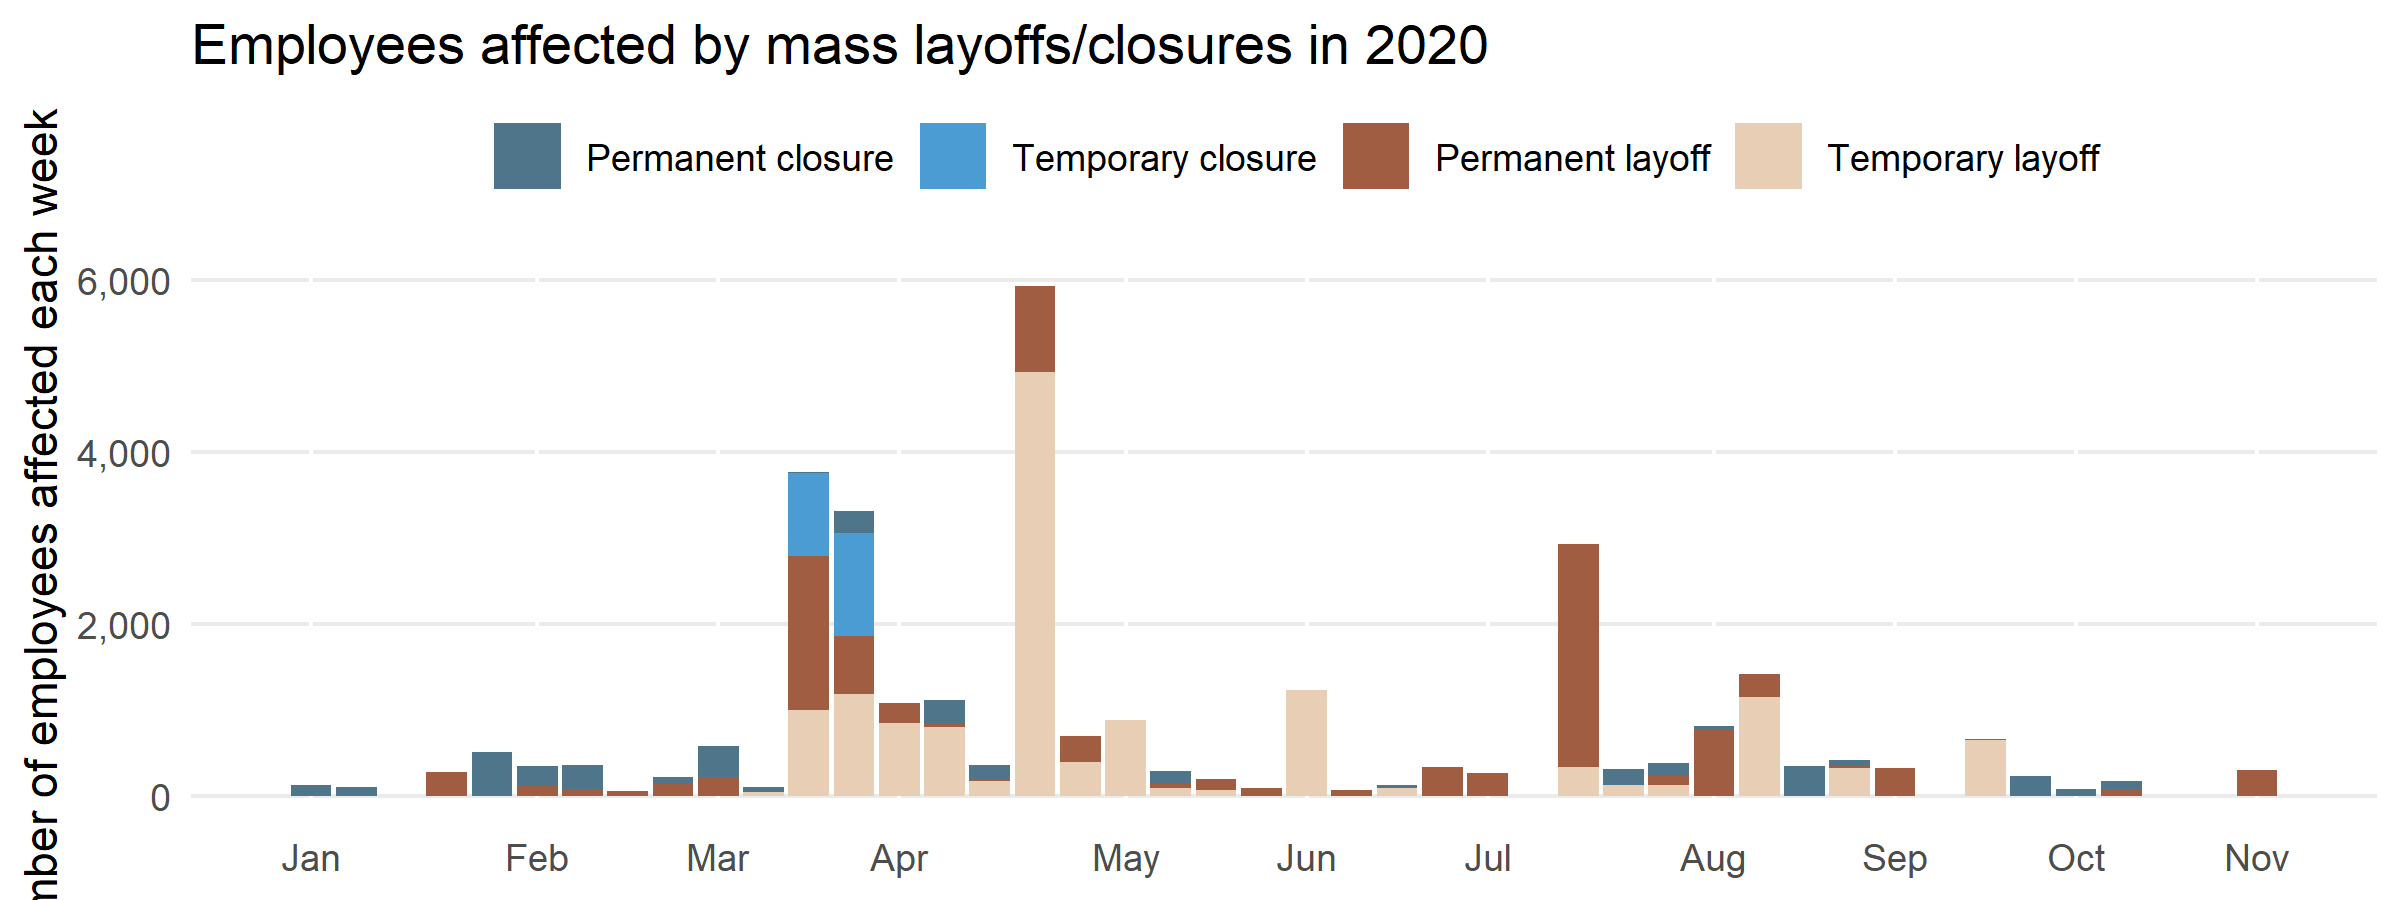
In the spring of 2020, there was a dramatic spike in the number of mass layoff events, peaking in the last week of April, when 85 layoff events affected almost 6,000 employees across the state. Temporary closures were an isolated phenomenon that occurred at the end of March when non-essential services were closed. Although temporary layoffs continued to occur throughout the summer, they were less common than permanent layoffs and closures.
WARN Notices
The North Carolina Department of Commerce requires companies that either close a facility or conduct a mass layoff (more than 50 employees at a time) to submit a Worker Adjustment and Retraining Notification (WARN) Notice. While some companies do report closures affecting fewer than 50 employees, they are not required to do so. As a result, the data from these reports do not represent all job losses in the state but only mass layoff events.
In October and November, the statewide pattern of mass layoffs and closures declined to more typical pre-pandemic levels. However, the timing and location of these events has very different impacts in local communities.
Assessing impact
We normalized the total number of layoffs in the data by dividing the number of employees affected by layoff events by the total number of employees at large firms (50+ employees) in each county. This lets us measure the differential impact of layoff events in North Carolina counties. For example, a single event in March affecting 205 jobs in Anson County impacted 58 per thousand employees at large establishments, but a similar event in next-door Union County affecting 198 jobs had less than one tenth of that impact, at only 5 per thousand.
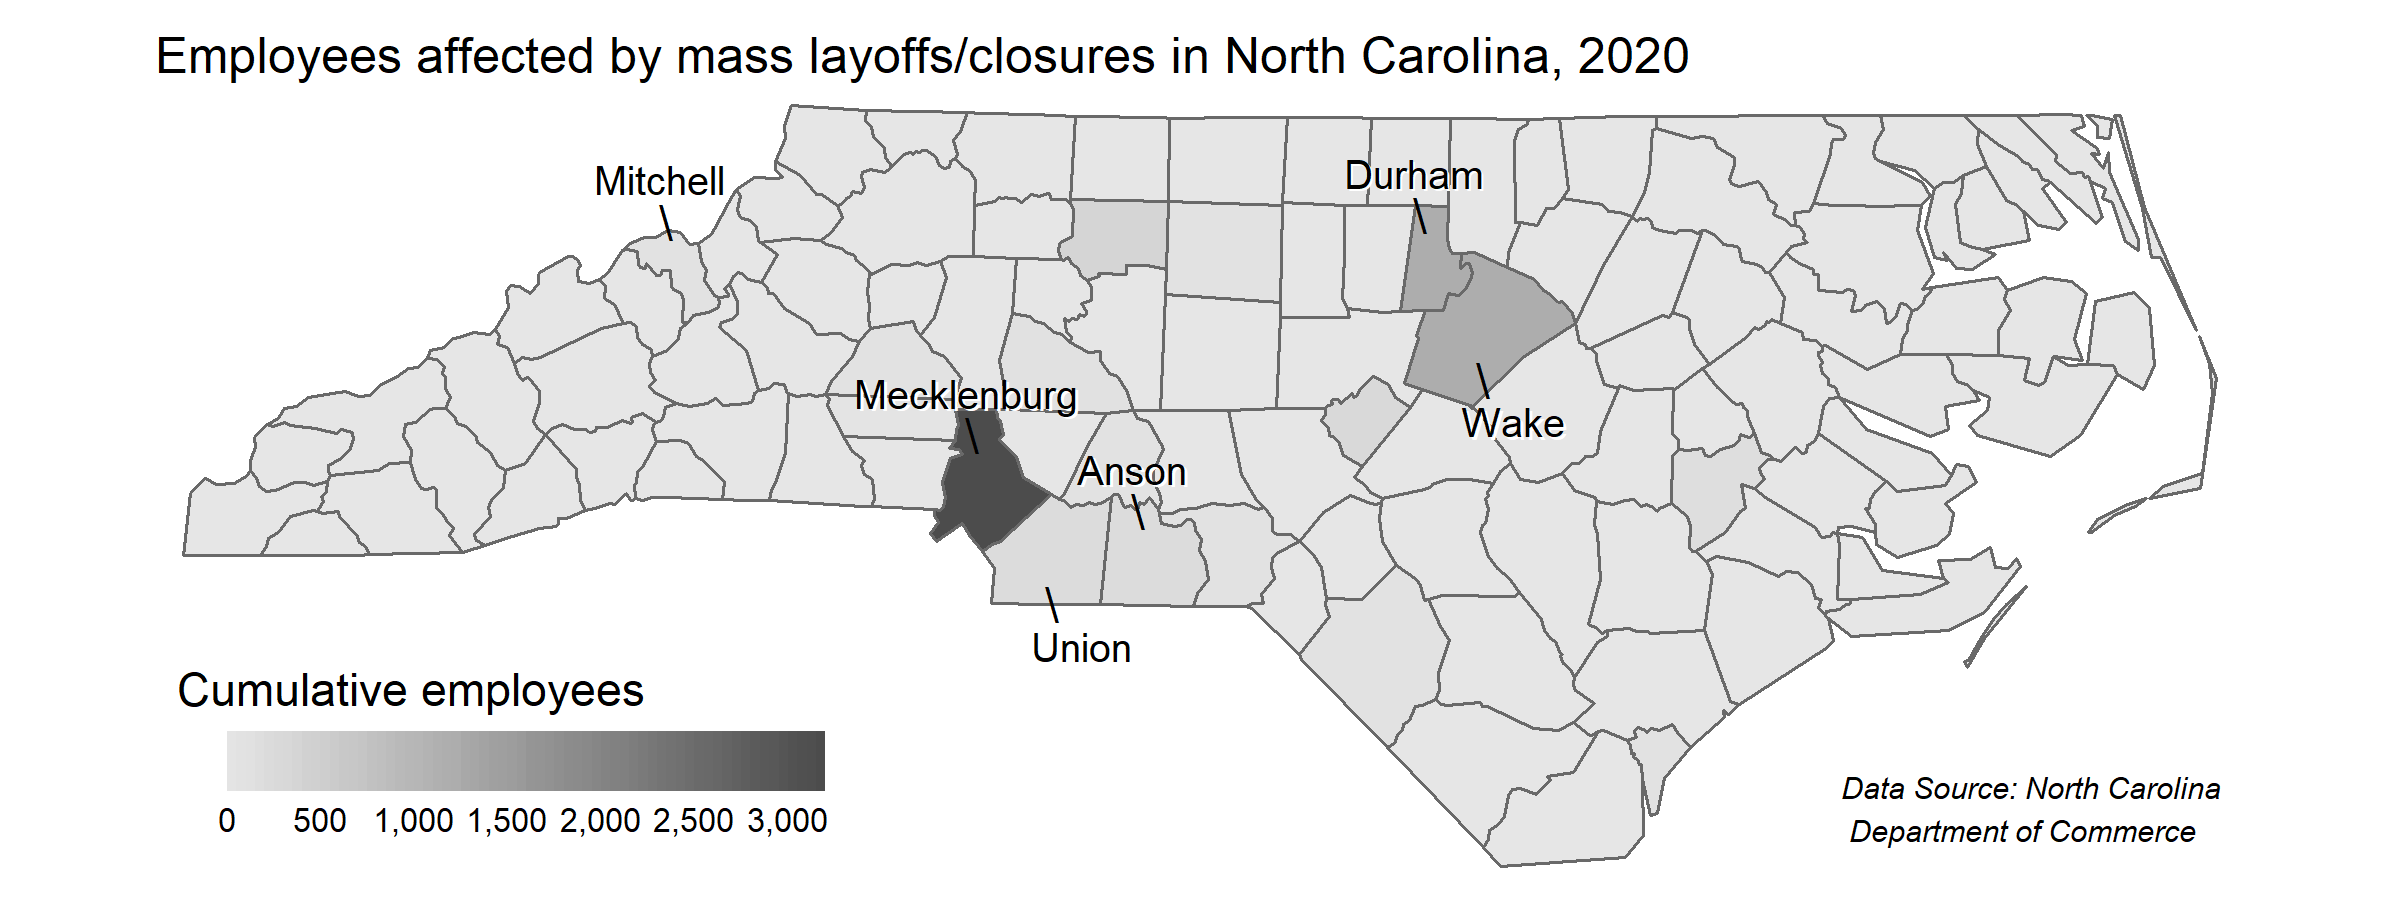
North Carolina’s largest counties – Mecklenburg, Wake, and Durham – have borne the brunt of the later wave of closures that occurred after Phase 1 and 2 reopenings. However, these counties have large workforces, so the total numbers can misrepresent the impact that the layoff events have on local economies.
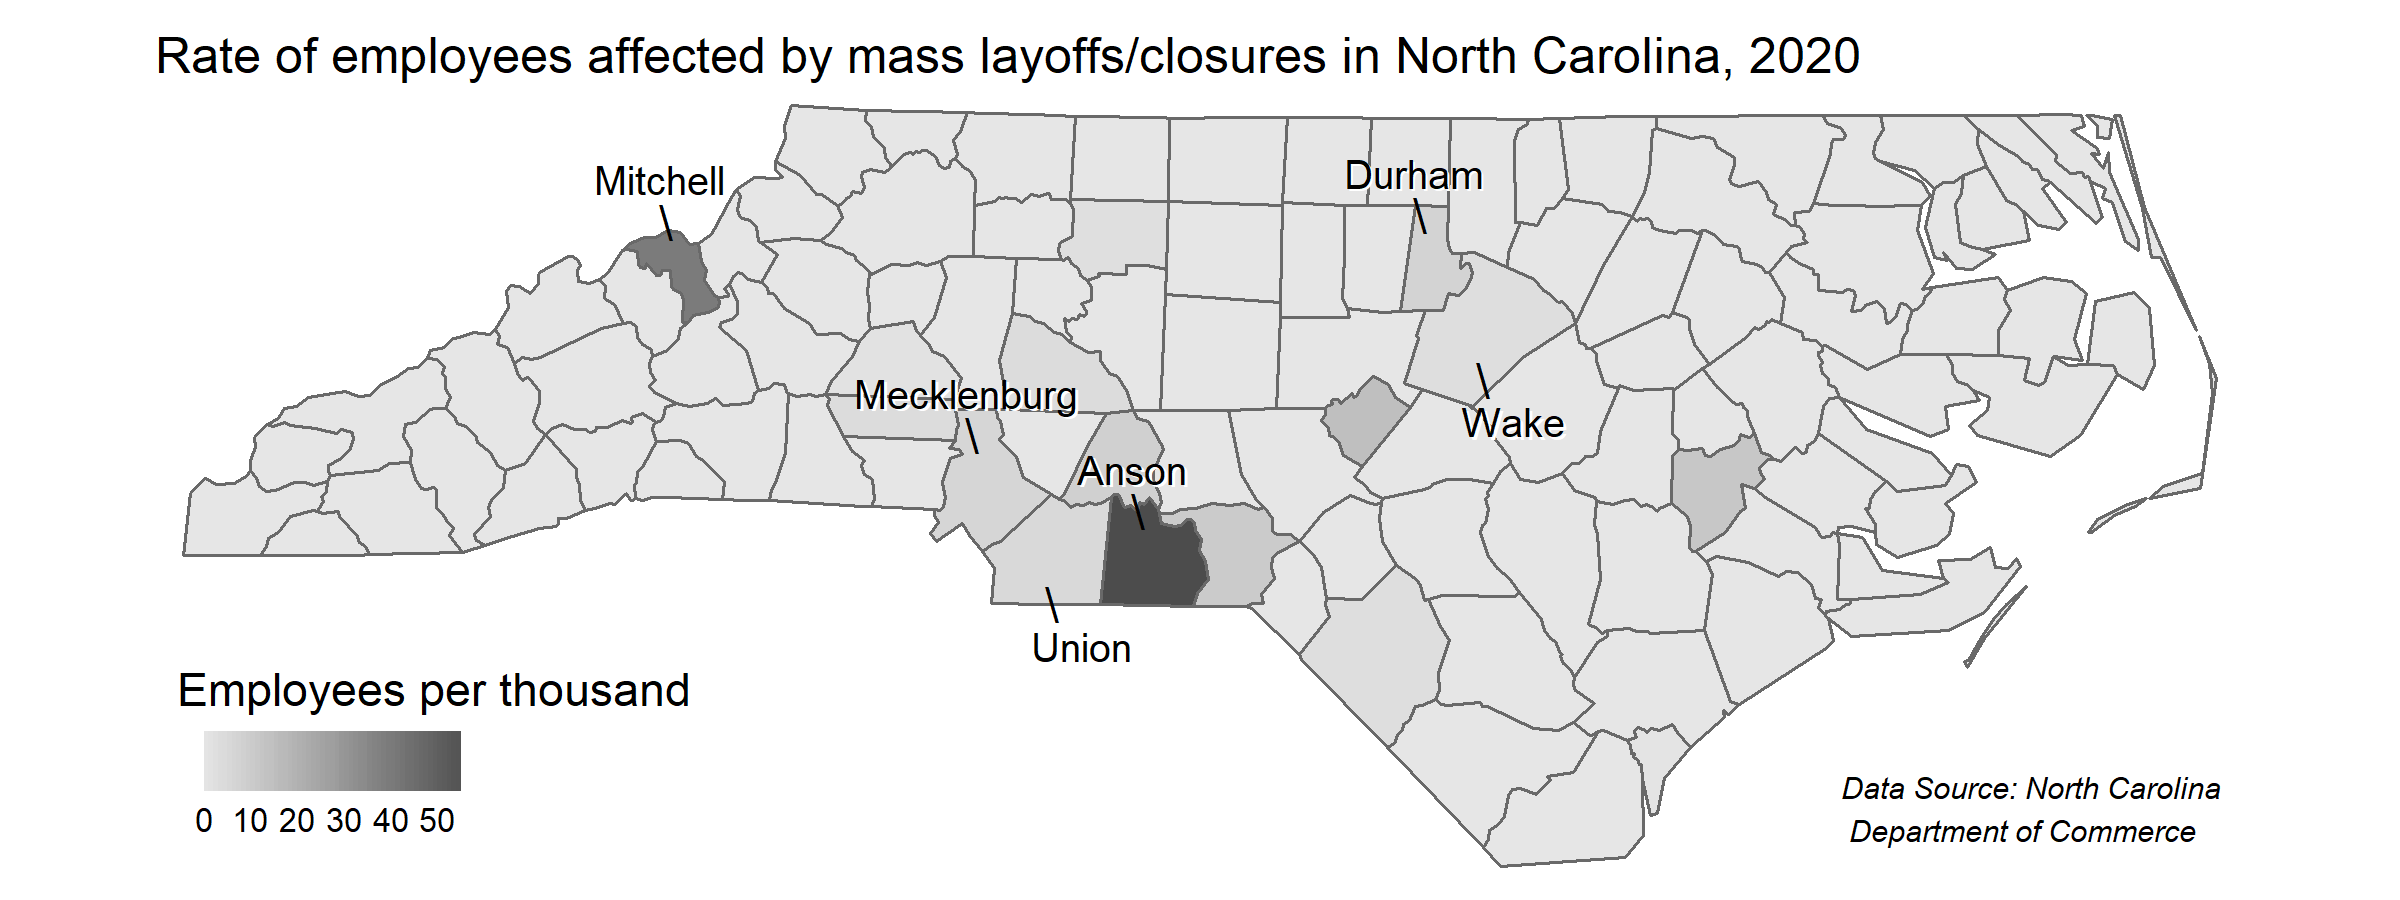
In these three populous counties, the rate of employee layoffs represented in the second map is close to the statewide rate of employees affected by layoffs, which is about 2 per thousand workers at large establishments. Durham has been hit harder than Mecklenburg and Wake counties, with a rate of 7 jobs lost per thousand.
In contrast, the non-CBSA county of Mitchell has the second-highest rate of impact after Anson, with 40 jobs lost per thousand in a single event in late May. Although this affected only 88 employees, it had a large impact on the county’s economy.
Policy implications
Researchers and policymakers should use rates to assess the relative severity of mass layoffs on workers in North Carolina’s counties and identify areas that are burdened by mass layoffs. Event-level analysis in these areas may reveal patterns about the types of businesses experiencing layoffs and closures.
