By Ethan Sleeman | January 13, 2021
High Sales Numbers in Population Centers Belies Relative Surge in Demand for Homes in Outlying Regions
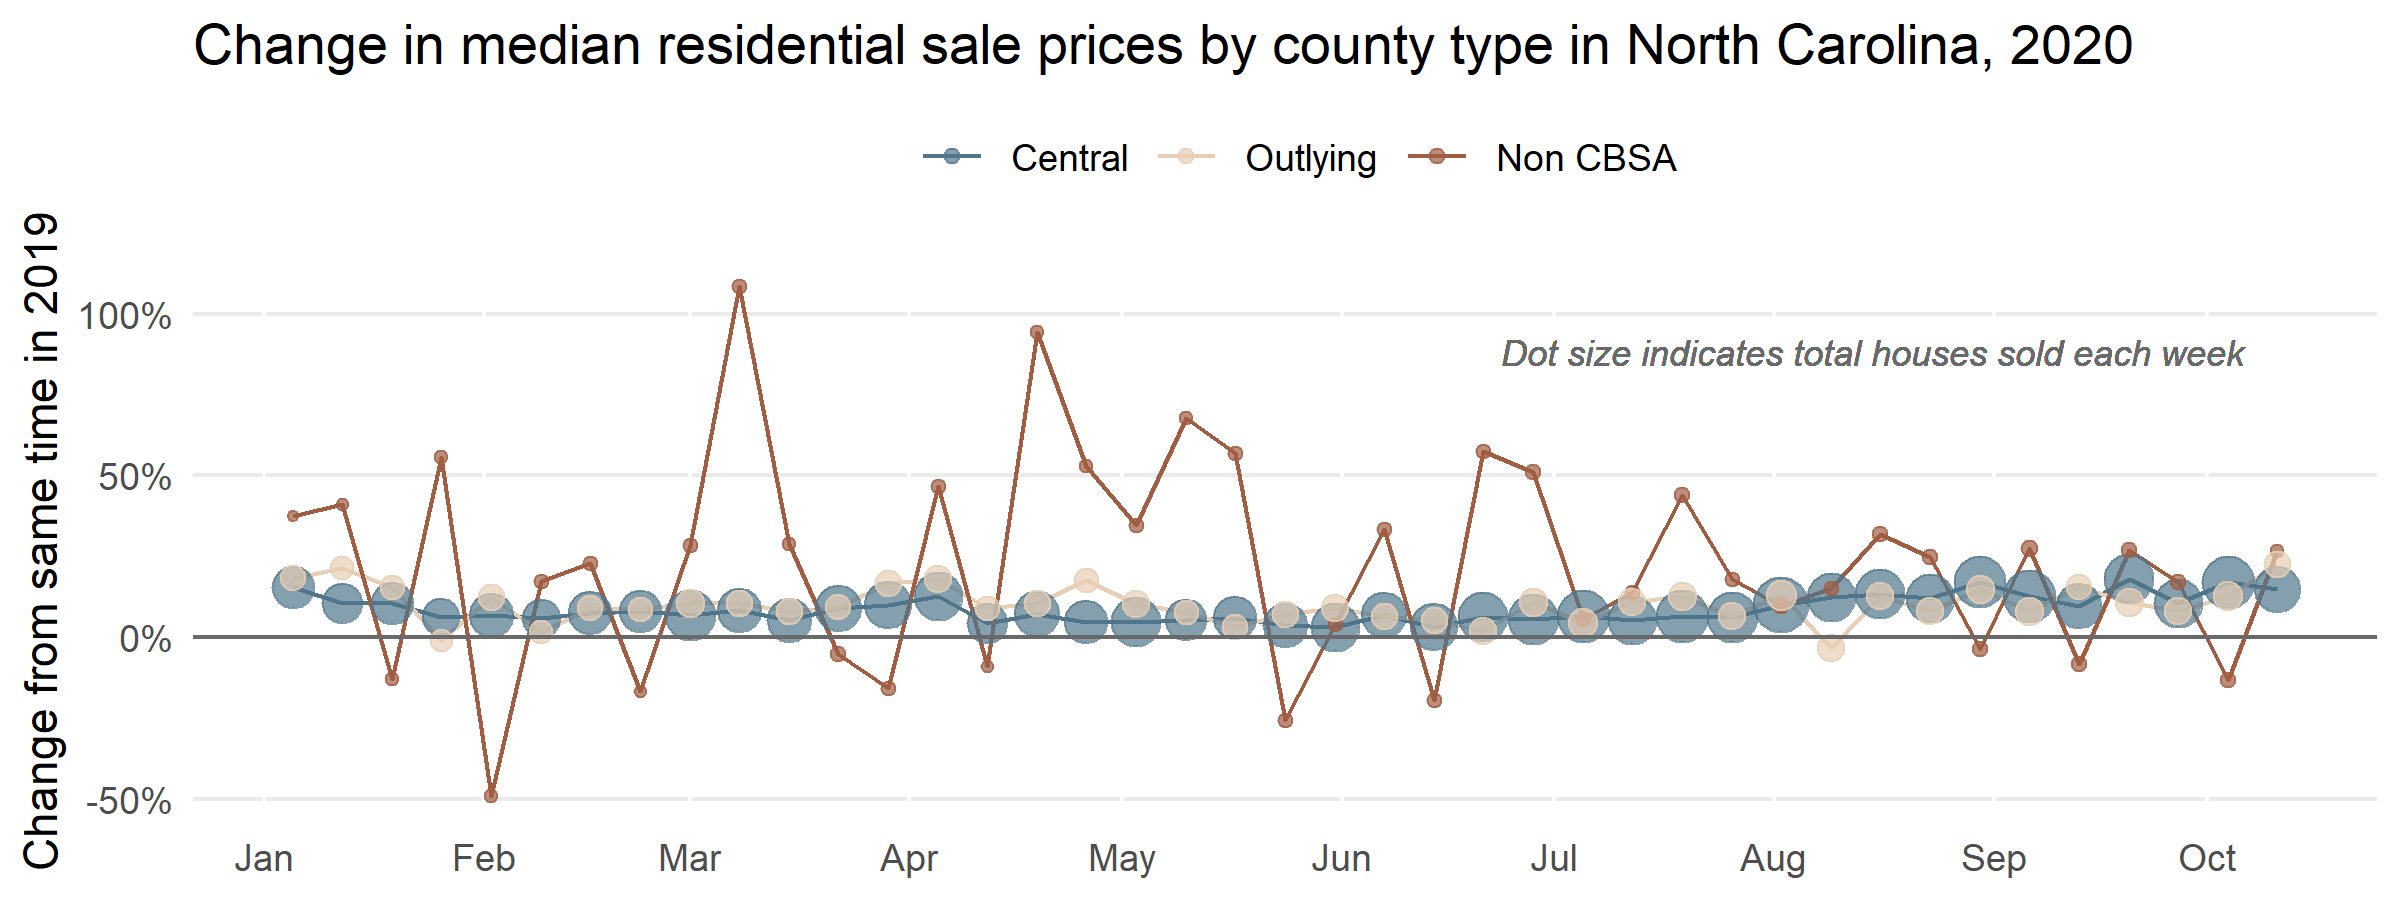
Across the state there has been a significant rise in demand for homes, with sale prices up, time-on-market down, and virtually 1 in every 3 houses being sold above listing price. When we break down the data in a more categorical analysis though, we see noticeable differences in the year-over-year changes in sales volumes, as well as in sale prices1. Looking at raw totals, it is unsurprising to see that Wake and Mecklenburg counties – the state’s most populous counties – have seen the highest volumes of sales in 2020, nearly 200 more per week than any other county. However, these central CBSA counties are not the ones seeing the greatest relative change from 2019; instead, it is outlying areas, and those beyond commuting range of central urban areas, that are seeing the greatest relative growth in sales and prices. In the year-over-year change data, we may be seeing early evidence of a shifting preference towards living outside of urban centers.
Non-CBSA Counties see Greatest YOY Growth in Sales Prices and Volumes
Non-CBSA counties have seen the widest variation in Year-over-Year change (YOY), but also the highest YOY values, with homes selling more than 50% above 2019 prices for much of the year since March 2020. Non-CBSA counties have seen the greatest change in sales volume over 2019 as well. Outlying counties have also seen higher rates of YOY change in median sales price than central counties.

The jump in both sales and sales prices points to a demand surge in those counties. Since the onset of the pandemic, there has been a significant growth in demand for homes outside of the state’s core urban areas, such as central CBSA counties, a demand that is not matched (relatively) in central counties. The areas seeing the greatest relative growth in demand, though, are in areas that fall not just outside urban centers, but outside even the typical commuting range of urban centers.
Teleworking, Virus Concerns, and Affordability May be Driving Moves Away from Urban Centers
In a previous post published by Carolina Tracker we discussed how reported preferences for more space, additional rooms for home offices, and larger yards were driving a surge in demand for homes, bidding up the market. This preference may be driving some to consider moving into these non-CBSA and outlying CBSA counties. An increased decoupling of work from fixed places (at least among some occupations) as a result of tele-working has opened the possibility of living outside the traditional commuting range of urban areas. This is potentially contributing to the increase in sales in areas further afield. As noted in a Forbes piece from this past August, perceptions of safety may also be playing a factor. Areas perceived as ‘rural’ are popularly viewed as less prone to widespread COVID infection. And while non-CBSA does not equate to rural, those counties with low population density and little economic ties to central urban areas do possess ‘rural character’ as popularly understood. So too do outlying counties in metro and micropolitan areas; perceptions of rural safety may potentially be fuelling the rise in sales in those regions as well.
Perhaps one of the greatest inducements, of course, is simple affordability. While median sale prices in non-CBSA counties have fluctuated, this may be a factor of the limited data coverage inherent in Redfin’s data. Nonetheless we see that both outlying CBSA and non-CBSA counties generally have lower median sales prices than in central CBSA counties. The possibility of securing more space, in an area that is perceived as ‘safer’ from pandemic, and at a price considerably below the cost of living in a central urban area; taken all together, these may create a strong inducement to move.
Shifts to non-CBSA and Outlying Counties may Put Pressure on Affordability, Healthcare Resources
Areas outside the range of metro- and micropolitan urban centers frequently have fewer healthcare resources (which are concentrated in population centers), as well as areas with lower median incomes. Given increased demand for homes in these areas, it is likely that they are seeing growth which may tax existing healthcare resources. While we lack information on the incomes of those purchasing homes, the sharp rise in sales prices tells us that those making recent purchases have significantly greater buying power than previous purchasers. The implication: people with higher incomes than typical in these counties are the ones purchasing homes. Local leadership may want to keep a close eye on the effects of demand and buying power on local home prices: a significant long-term rise in property values may create affordability challenges for lower-income residents.
- Using Year-over-Year change from the same month in 2019 allows us to account for seasonal trends in housing markets (higher sales in summer months, etc.) and makes for a reasonable comparison between markets with significant differences in volume and median sales prices. [return]
